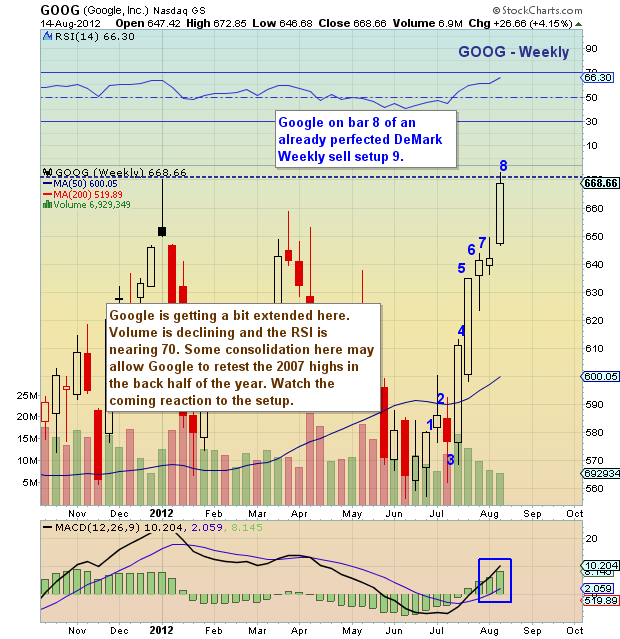
 Here is an update to last week’s chartology pointing out Google’s impending thrust higher into a parallel DeMark weekly sell setup count. Hopefully some of you were able to get into Google and remain patient! I personally tried to get cute and take gains last week, hoping to buy back lower.
With the run higher into 2012 highs, and the setup nearing 9, longs may want to lighten up over the next 2 weeks, watching the stocks reaction to the setup.
Google stock chart with price support and resistance levels. GOOG stock chart with technical analysis as of August 14, 2012. GOOG weekly DeMark sell setup count.
———————————————————
Twitter: @andrewnyquist and @seeitmarket Facebook: See It Market
No positions in any of the securities mentioned at the time of publication.
Any opinions expressed herein are solely those of the author, and do not in any way represent the views or opinions of his employer or any other person or entity.


