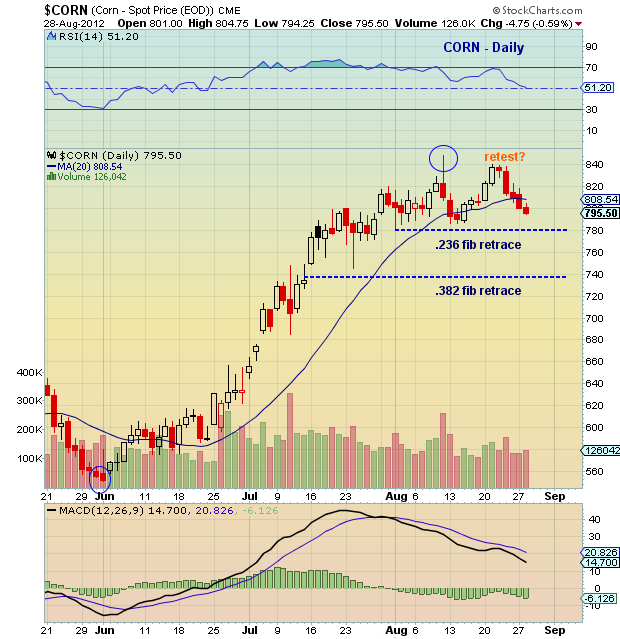
 After an amazing run higher, Corn spot prices have begun to pullback/consolidate (see previous Corn Chartology).
But what happens over the next week will be important. Why? Because Corn is two weeks into a weekly DeMark sell setup with a reaction period up to 4 bars (weeks). Well, we received the reaction lower over the past week, so follow through will be key for the bears. However, without follow through, Corn prices may simply be consolidating.
More charts found here.
Corn price charts as of August 28, 2012. Corn charts with trend lines and technical support levels. Corn technical analysis with Fibonacci retrace levels. Corn drought and Demark analysis.
———————————————————
Twitter: @andrewnyquist and @seeitmarket Facebook: See It Market
No position in any of the securities mentioned at the time of publication.
Any opinions expressed herein are solely those of the author, and do not in any way represent the views or opinions of his employer or any other person or entity.


