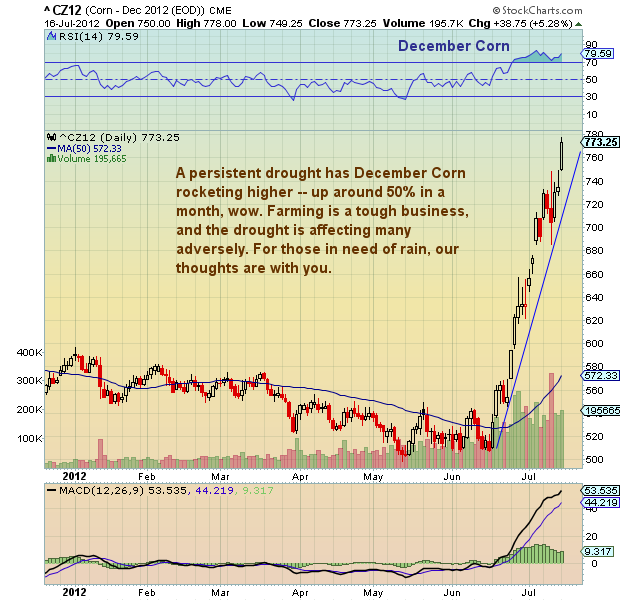
 This isn’t the way most farmers want corn prices to rise. The persistent drought has lifted December Corn (CZ12) by 50 percent and has many farmers praying for rain.
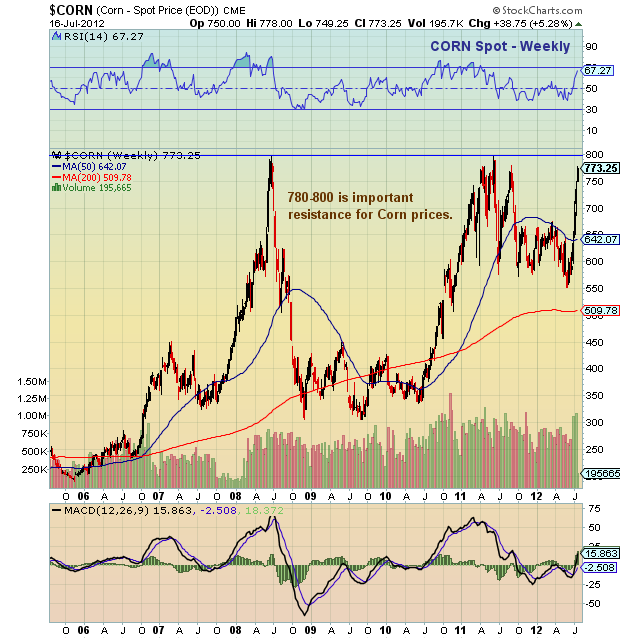
As illustrated in the charts below, Corn prices have taken flight, bumping up against Spring 2008 and 2011 highs. This band of important resistance lies around 780 to 800 and if broken will speak volumes about the speculative impact the drought may have on yields and subsequent price speculation. The round number of 10 dollars/bushel may become magnetic if prices sustain a move above 8 dollars.
Corn price charts with support and resistance, trend lines, and price analysis as of July 16, 2012. December corn prices higher on severe summer drought. 7 year corn price chart shows resistance at 800.
———————————————————
Twitter: @andrewnyquist and @seeitmarket Facebook: See It Market
No position in any of the securities mentioned at the time of publication.
Any opinions expressed herein are solely those of the author, and do not in any way represent the views or opinions of his employer or any other person or entity.


