It’s been a wild ride for Gold prices of late. After a big selloff into early November, Gold futures have rallied back to $1200/oz. But let’s step back for a moment and recap the price action. Just over 3 weeks ago I did an article on Gold Futures. In that article the highlights were:
- A current daily target of 1150.60.
- A weekly target of 1138.10.
- The significance of the 1179.40 support level.
- 3 levels of support at 1652.66, 1589.00 and 1584.59 on the Goldman Sachs Precious Metals Index (GPX)
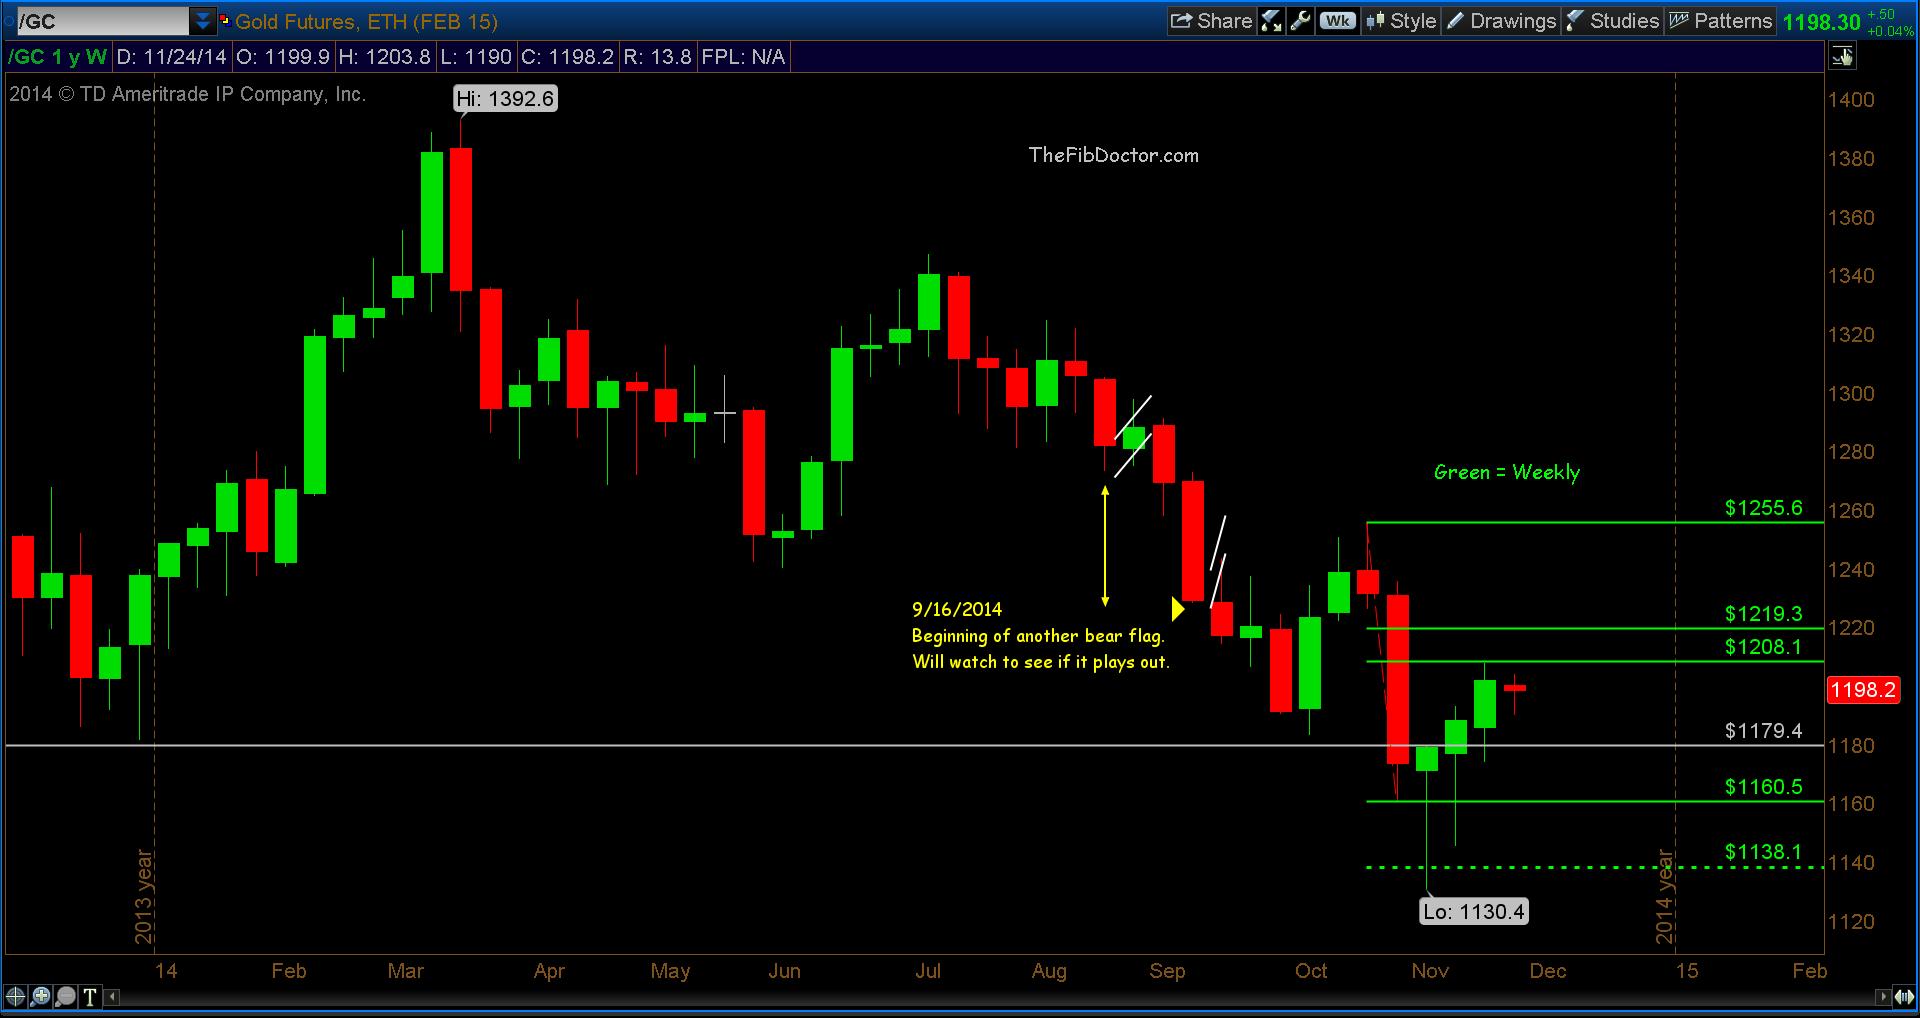
Since that time, the daily target of 1150.60 was hit as well as the weekly target of 1138.10. Gold futures found support just below the weekly target at 1130.40 and have been able to push up a respectable 6.82% to the recent high of 1207.60 on November 21st. At the time of this post, gold is currently trading in the 1198 – 1200 range.
In the chart below, you can clearly see that gold is struggling to get above the weekly resistance levels of 1208.10 and 1219.30. Not being able to reach even the first weekly resistance level (although it came close) should give bulls reason for concern.
Gold Futures 1 Year Weekly Chart
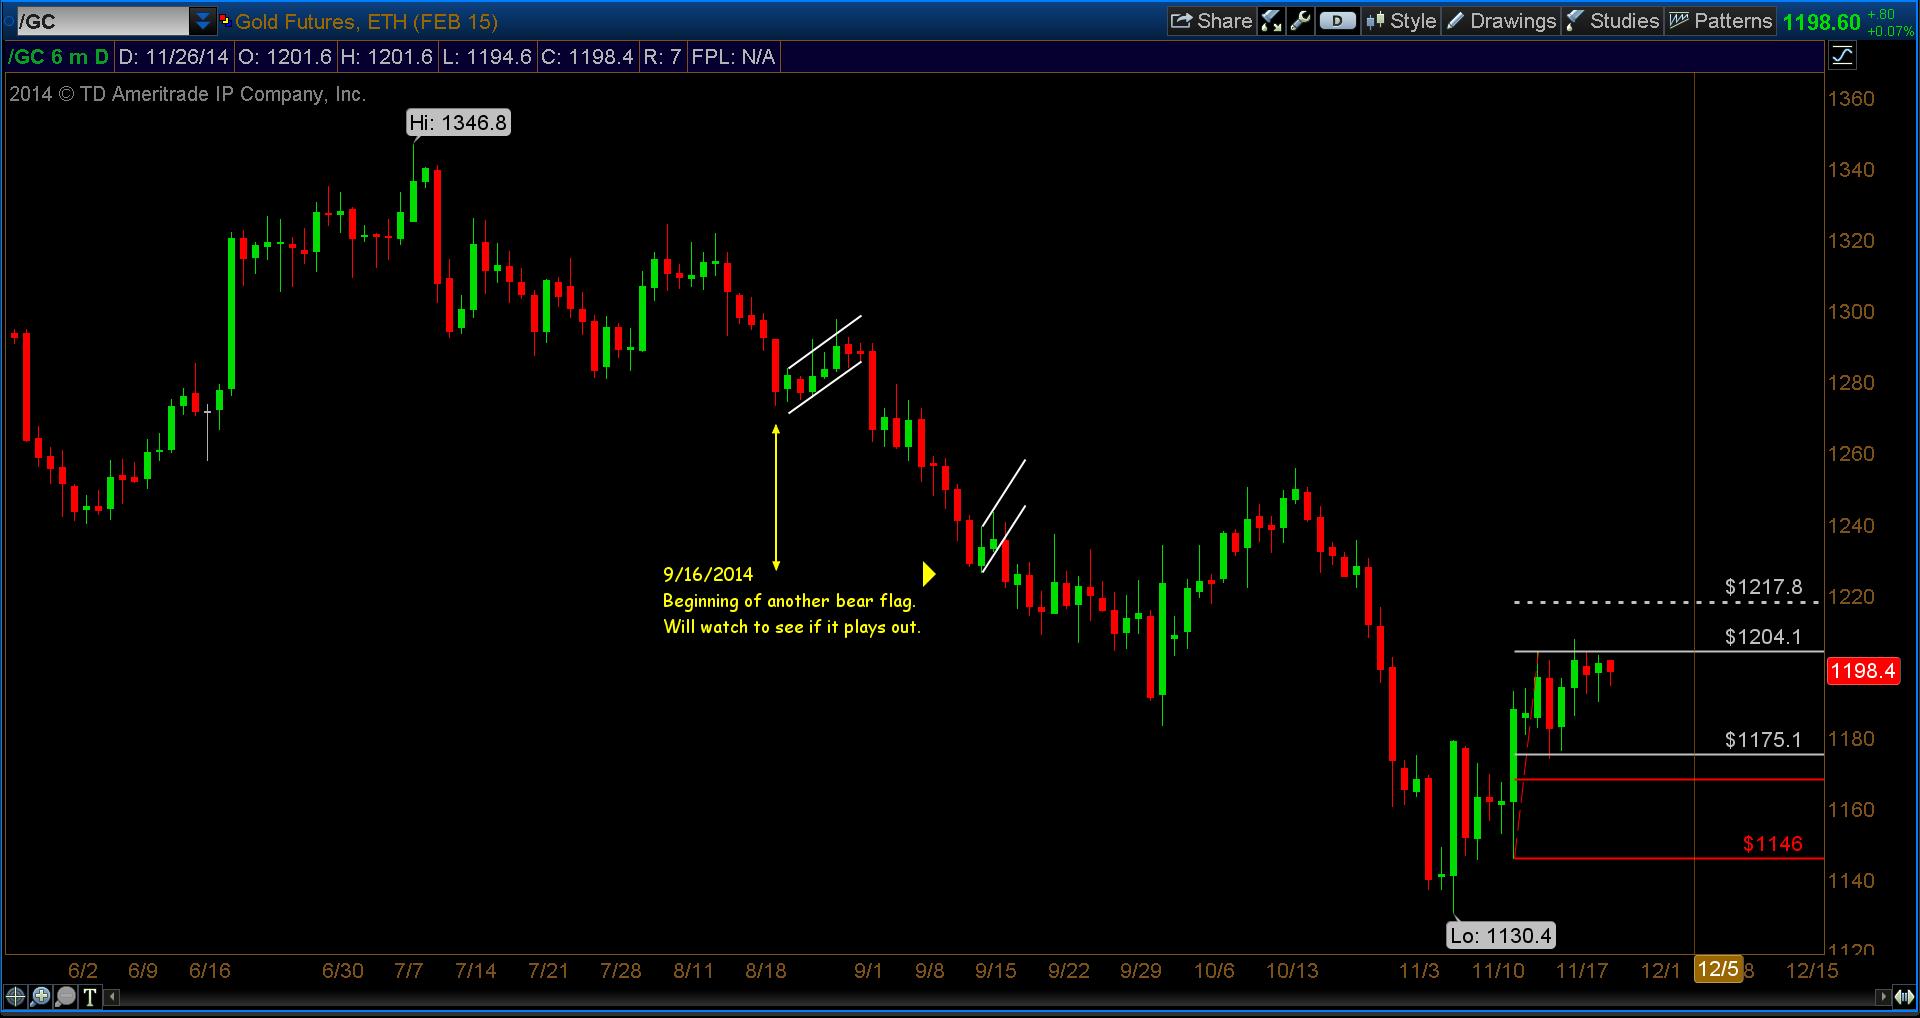
Now let’s drill down a bit and look at Gold Futures on a daily basis. In the chart below you can see price was able to push up enough to create an upside Fibonacci target on the daily chart of 1217.80. That is also an area of confluence with the weekly second resistance level being 1219.30, which I suspect will be strong resistance.
If gold is able to push through these levels, there are many more resistance levels it would have to clear before bulls could comfortably claim a foothold.
Gold Futures Daily Chart
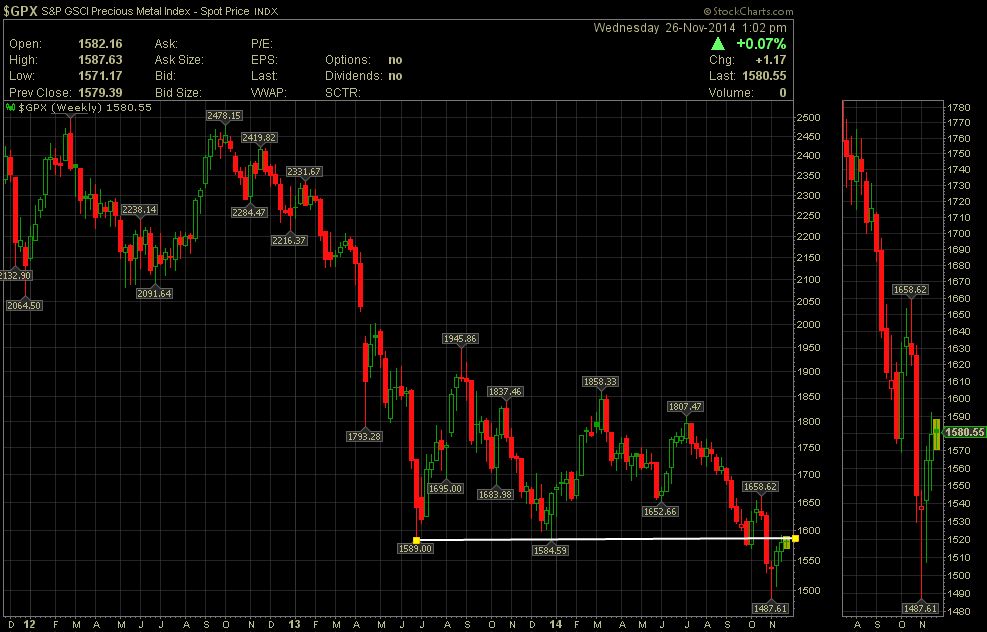
Now to the Goldman Sachs Precious Metals Index (GPX). It had previously broken 3 support levels of 1652.66, 1589.00 and 1584.59. As of this post, it is currently at 1580.55. The preceding 3 levels of support have now become resistance.
Goldman Sachs Precious Metals Index (GPX) – Daily Chart
Always use a stop and thanks for reading!
Follow Dave on Twitter: @TheFibDoctor
No position in any of the mentioned securities at the time of publication. Any opinions expressed herein are solely those of the author, and do not in any way represent the views or opinions of any other person or entity.


")

 Ready To Break Out?")