The following first appeared as the June 2016 edition of the J. Lyons Fund Management, Inc. Newsletter at www.jlfmi.com
Positive developments in recent months may have extended the life of the bull market — but for how long?
“One more day to complete my service.
One more high to decay my nervous.
Wondering how I’m gonna find, it’s over.”
– Nirvana – “Old Age”
It’s no secret that we have been concerned about a potential bull market top of some significance forming over the past 12 months (or longer). In fact, as we have documented, many pieces of evidence pointing to the immediacy of such a potential top have been accumulating over that time. The substantial deterioration in the broad market last year, as revealed through the collapse in breadth was a major red flag. Additionally, what looked like the final bull market holdout – prices of the major stock averages – finally gave way last summer. And it continued into the early part of this year. So the cyclical stock market top that we were concerned about looked as if it was indeed unfolding on schedule.
Our view of the ultimate fate of the market cycle has not changed, particularly as it pertains to the broad market of stocks. There are simply too many secular excesses that have yet to be worked off. However, our view of the path leading to that eventual end-game may have been altered somewhat in recent months. Specifically, the timing of the onset of the cyclical bear market may have been forestalled.
Our consideration of this potential “stay of execution” of the bull market has stemmed from a series of recent positive developments. I write that in the context of the better-than-expected post-February stock market rally. Some of these bullish factors have already played themselves out while others remain constructive. Still other potential positives require close monitoring as the extent of their influence is up in the air. This piece will take a look at some of the developments that caused us to upgrade our assessment of the rally in recent months. Additionally, we will take stock of the present status of these factors in the context of their potential remaining positive influence.
Again, our analysis does not suggest that a cyclical top, and the accompanying supporting evidence of the past 12 months, is to be dismissed. That scenario still appears to be on track. However, the aforementioned positive developments may have bought the bull market a little more time, and perhaps another high, before its eventual slaughter.
Disclaimer: While this study is a useful exercise, JLFMI’s actual investment decisions are based on our proprietary models. Therefore, the conclusions based on the study in this newsletter may or may not be consistent with JLFMI’s actual investment posture at any given time. Additionally, the commentary here should not be taken as a recommendation to invest in any specific securities or according to any specific methodologies.
NYSE Advance-Decline Line
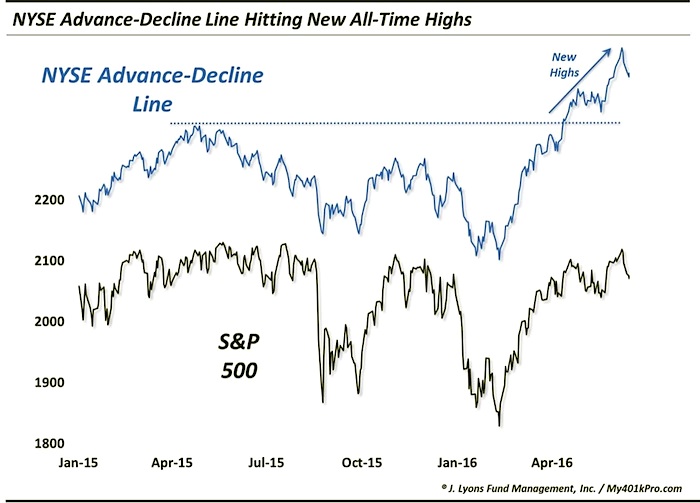
So what are these positive developments for the aging bull market? Not the least of them is the fact that the NYSE advance-decline line has gone to a new all-time high.
As a refresher, the advance-decline line is a running cumulative total of the daily difference between advancing issues on the NYSE and declining issues. If this “A-D” Line is moving upward along with the stock indexes, it represents strong participation within the broader market. And as we have said many times, the better the participation, the healthier the market. Since the mid-February stock market low, the A-D Line has indeed been moving upward, hitting its first new high in April after 355 days.
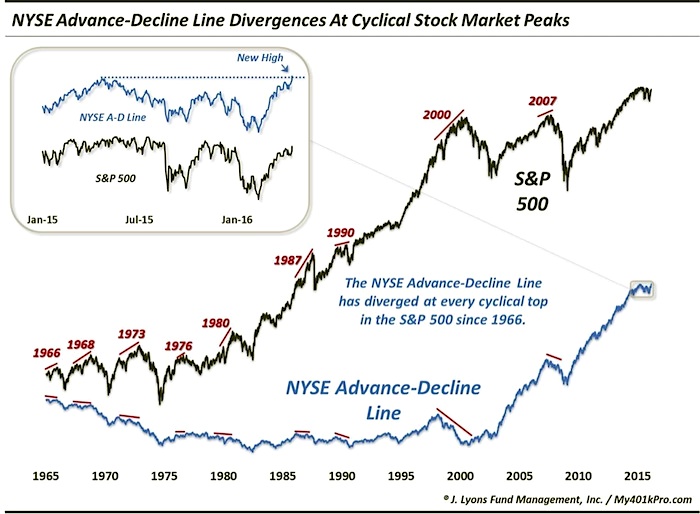
So what is the significance of the new high? The NYSE A-D Line has negatively diverged at every cyclical top in the S&P 500 in the last 50 years.
So what now? Does the new high in the A-D Line mean the bull market is back on track – or never left? Not necessarily. Our best guess still, based on all the evidence at hand, is that the broad stock market formed (or is still forming) a cyclical top over the past 12 months. We realize that may be a difficult proposition to grasp for market observers who only watch the price of the S&P 500.
However, consider the fact that broader averages like the NYSE Composite, the Value Line Arithmetic Index (i.e., average stock) and the Value Line Geometric Composite (median) are still some 10%-15% below their highs of a year ago. Also consider the litany of examples of deterioration in market internals that we’ve documented over the past year which have traditionally led to multi-year struggles in the broad equity market. These factors (and others) combined still point to a strong likelihood that the market action of the past 12 months is part of a topping process. And this is another hurdle for the aging bull market.
Strictly based on the historical relationship of the NYSE A-D Line and S&P 500 around cyclical tops, however, the evidence would suggest that the S&P 500 has not yet made its final high for the cycle. Remember that the A-D Line has topped before the index at every cyclical top in the last 50 years, without exception. Now, it is possible that last year’s A-D line divergence at the high still “counts”, despite its recent run to a new high. However, based on the traditional relationship, the fact that the NYSE A-D Line has hit a new high suggests that A) the A-D Line has not put in its ultimate divergence and, therefore, B) the S&P 500 has not yet topped.
Even if this relationship holds true and the final market top is still ahead of us, it does not tell us how far out or how much higher the S&P 500 rally might extend (and bull market). The A-D Line could top next week and the index shortly following for all we know. However, if history holds true to form here, the S&P 500 all-time high close of 2130.82 on May 21, 2015 will not be the final high of this cycle.
Laggards Provide Fresh Fuel
While the bounce in the stock market in mid-February was not a surprise, its potential magnitude of course was an unknown. Would it be simply a mean-reversion, dead-cat bounce to relieve “oversold” conditions? That scenario would play into the premise that the bounce simply equated to a “bear market rally” and had limited potential upside. Or would it be more than that – possibly containing the potential for new highs in the major stock market averages? The determination, as always, is best made by judging the “quality” of the rally as it unfolds.
By “quality”, we mean measuring factors like the breadth associated with the rally (how many stocks were participating, e.g., the Advance-Decline Line), the pace of the rally (how quickly it could retrace the preceding losses), as well as sentiment (would investors be too quick to shift to bullishness or maintain a “healthy” skepticism). As it unfolded, based on these metrics, we judged the quality of the rally to be very good. The pace of advance was swift and the participation among stocks was excellent. As well, investors were slow to believe in the stock market rally, at least not to an unhealthy level.
In early April, however, the rally hit a wall as most of the major stock market averages and sectors ran into significant resistance levels. At that point, the former relative strength leaders, i.e., the defensive sectors like consumer staples and utilities, etc. were quite extended already. On the other hand, while they were not at all extended on a longer-term basis, the formerly lagging areas of the market (e.g., commodity-related sectors, high-beta, international markets, etc.) had rallied up to significant resistance of their own. The question was, would this be the end of the road for these laggards, suggesting the move was merely a mean-reversion bounce in those areas of the market?
This was a key question as it could determine whether the rally had run its course, or was simply set for a pause before continuing higher. And one development that would go a long way toward the “just a pause” scenario would be a breakthrough of resistance levels among these beaten-down and speculative laggards. Such a development would suggest the potential of a rotation of new leadership from the more defensive areas to the more “risk-on” areas of the market. This could give the rally the jolt of energy needed to propel it on to a new, more durable leg of advance.
In early to mid-April, many of these speculative laggards were indeed successful in breaking above the former lines of resistance. This brought an immediate jolt to the market, lifting stocks to new rally highs over the next few weeks. It also brings the potential for a further, more significant extension of the rally, if these areas can hold up.
Here are a few examples of laggard breakouts that have the potential to provide more rotational fuel to the rally.
Oil Stocks
If there is one sector that holds the key to the “rally is over” vs. “just a pause” consideration, it is oil stocks. They, of course, led the way lower over the past year and now have the chance to lead the way higher and buy the bull market a bit more time. Like several of the other former laggards, oil stocks (represented here by the NYSE Oil & Gas Index, XOI) broke above key resistance in mid-April, leading to a further pop in equities.
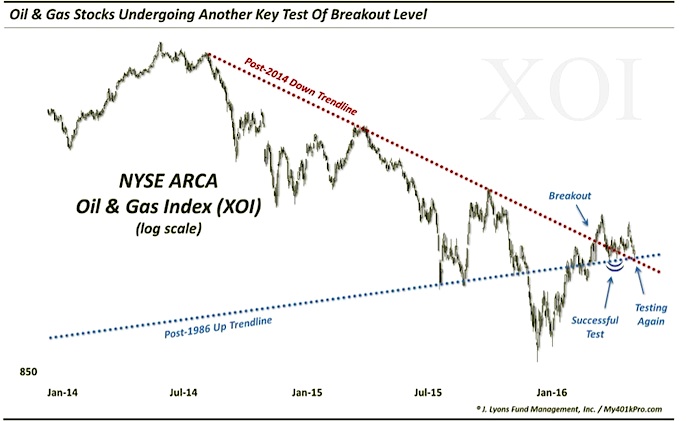
In the April-May pullback, the group retreated to test its breakout point. The test proved successful, leading to a short-term bounce. However, the sector was unable to climb to a comfortable distance above the breakout area and has presently returned to test the breakout level once again. Thus, these developments bear close monitoring. The reaction of oil stocks here could go a long way toward determining the potential for further upside to the rally.
High-Beta
One formerly lagging area whose fuel would be greatly appreciated by stock bulls is the high beta category. The behavior of these stocks can instruct us as to the willingness of investors to take on risk. If high beta stocks are rallying, “risk-on” is in effect. Conversely, if high beta stocks are floundering, investors are more likely concerned with protecting their capital, i.e., “risk-off”. This area (as represented by the S&P 500 High Beta ETF, SPHB) also broke above resistance in April.
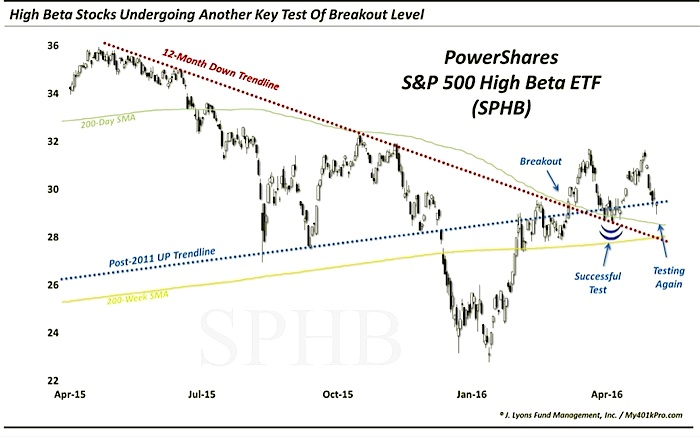
Like the oil sector, high-beta stocks pulled back to successfully test the breakout level last month. This group responded in an even stronger fashion to the test than did oil stocks. Even still, the group is also in the process of testing that breakout level once again. We will continue to monitor this high beta area for clues pointing to either risk-on or risk-off.
continue reading on the next page…


