Global Stocks
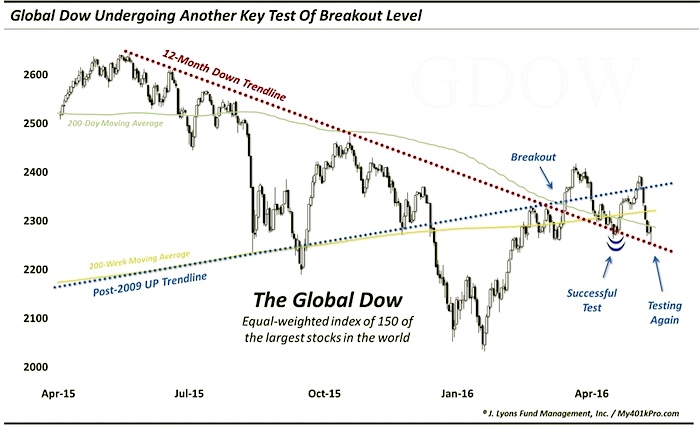
Lastly, outside of brief periods here and there, we have seen U.S. stocks lead the bull market higher in recent years. It is doubtful that the U.S. can continue to bear this burden of carrying the rest of the world. Sooner or later, other global markets will need to shoulder some of the weight. We can see in the chart of the Global Dow index below that global stocks have been in a pronounced downtrend for the past year, even as the U.S. stock market has generally moved sideways. In April, we did see global stocks jump on board and participate in this rally as the Global Dow jumped above significant resistance. Again, this provided some needed juice to the market when it was slowing.
Like the other sectors mentioned, the Global Dow also pulled back to successfully test its breakout level in May. However, as with the oil and high beta stocks, the Global Dow has also pulled back to test the breakout level once again.
In the longer-term, obviously these breakouts among the laggards are only meaningful if they can be sustained. Therefore, it may not be overstating things to say that the longer-term potential of the post-February stock market rally, in general, may very well depend on the ability of these areas to successfully defend their breakout levels once again. A failure of these former laggards to hold here could suggest the end of the line for the rally as these areas that appeared ready to fuel another leg up in the rally proved to be out of gas. On the other hand, a successful hold may enable these sectors to re-engage their rally and lead another risk-on advance in stocks.
There are certainly other recent positives like the expansion in new highs and various examples of extremely bearish sentiment would appear to add weight to the “stay of execution” argument. Thus, just maybe the bull market is not quite through running higher — even if it faces eventual slaughter.
Skeptical Sentiment
Another area whose behavior has unfolded in a constructive manner since the February stock market low is investor sentiment. Ideally, in order to prolong the life of a rally, bulls would like to see widespread disbelief among investors as a rally ensues. And as an advance progresses, a slowly gathering acceptance of rising prices brings new money to the market in a more durable fashion. As long as the bullishness doesn’t get too extreme, there presumably remains more money, i.e., more potential fuel, left to extend the rally. This has been the case during the post-February rally. At its early stages, traders were extremely skeptical. In the months since, sentiment indicators — both survey-based and real money — have fluctuated between mildly bullish and wildly bearish. For the most part, readings have been conducive to further rising prices. If anything, there have been some examples of unprecedentedly bearish sentiment, given the circumstances, that have left us scratching our heads.
Surveys
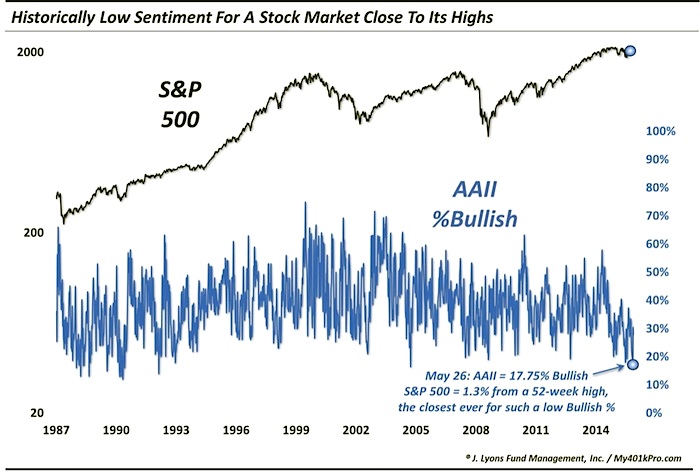
Among the various surveys of investor sentiment, most have been very slow to see a rise in bullishness since the February low. Yes, there are some fringe surveys that have seen sentiment get a bit over-heated in recent weeks. However, for the most part, investors’ proclaimed bullishness has, at best, collectively reached the neutral mark. And in some cases, bullishness has remained extremely subdued — even to record levels — relative to the action in the stock market. One example of this is in the popular American Association of Individual Investors (AAII) survey.
As of late May, AAII bullishness remained surprisingly low given the rally. In fact, the 17.75% bullish reading on May 26 was unprecedentedly low relative to the S&P 500’s proximity to its 52-week high — just 1.3% away. This skepticism is an indication of further potential fuel for the rally. Although, bullishness does need to rise as an indication that investors are indeed coming back into the market. And while the readings have risen slowly since late May, they are still very low on a relative basis.
Real Money
While surveys are interesting, and often helpful, in gauging how the collective investor community is thinking, we prefer real-money indicators in determining actual market sentiment. People can say whatever they want. However, what they do with their money is much more revealing from a sentiment standpoint. And, for the most part, real-money gauges have also been relatively subdued during the rally. Similar to the AAII behavior, some have even displayed extreme bearishness considering the moderate losses at any point in the post-February rally.
A case in point comes from the equity options market. Back in mid-May, traders in CBOE equity options were busy buying up puts in large numbers relative to calls. In fact, the 10-day average of the CBOE Equity options Put/Call ratio reached over 0.8% for just the 18th time since 2003. Of all 18 of those occurrences, this one transpired with the smallest drawdown of the S&P 500 from its 3-month high (-1.8%). As a matter of fact, the previous 17 occurred with the index a median -9.4% away from its high.
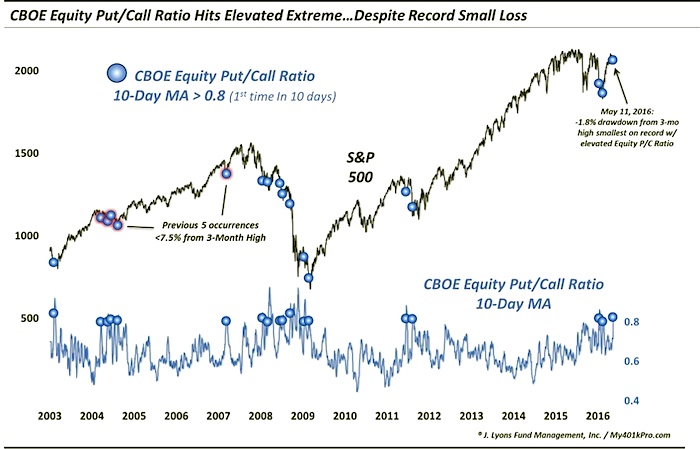
Prior readings of such elevated CBOE Equity Put/Call readings, i.e., elevated hedging, saw mixed returns in the stock market going forward. However, that is mainly due to those readings occurring during the 2008-2009 bear market. Outside of those, and particularly among the readings occurring while the S&P 500 was relatively near to its 52-week high, stocks showed a consistent tendency to rally in the short to intermediate-term. Indeed, this is one data point that has already seen some of its bullish ramifications manifested. The S&P 500 bounced some 4% in the weeks following the extremely high Put/Call reading. But while short-term readings have since cycled down to relative bullish extremes, on a longer-term basis there is plenty of room for an additional increase in bullishness in the options market.
Volatility
One wild card recently among indicators that we track comes from the volatility market. And we do mean wild. As with the equity options market, we have noticed an elevated degree of hedging lately in the volatility market as traders have positioned themselves in anticipation of an increase in volatility. Interestingly, we have found some evidence that the volatility market is unlike most markets wherein extreme readings can reliably be faded given that the crowd is typically wrong at extremes. Indeed, when volatility positioning has moved to an extreme, it has not been uncommon for volatility itself to trend that way, at least in the short-term. Thus, there has been a “smart money” component to the volatility market. And we saw that dynamic play out in spades recently.
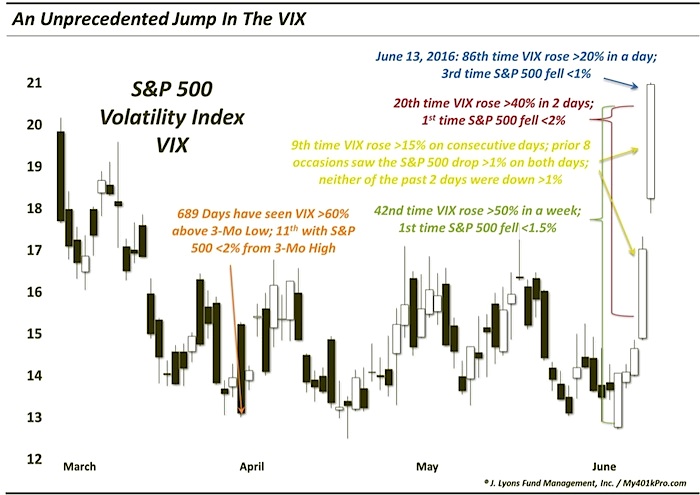
In another example of unprecedented behavior, volatility traders were handsomely rewarded for their relatively out-sized hedges over the past week as the S&P 500 Volatility Index (VIX) soared by a record amount, relative to the mild stock market decline. On a 1-day, 2-day and 1-week basis, VIX has never jumped as high as it did recently without a more significant decline in the S&P 500.
Is this record jump in the VIX a harbinger of ominous things to come in the stock market? Or are traders getting ahead of themselves given the stock market’s relatively close proximity still to its highs? Our guess is that the “smart money” volatility dynamic has already played itself out. That is, inasmuch as we could reasonably expect, the recent rise in volatility expectations has already rewarded those who were positioned for it. Any further rise in the VIX could likely not be explained by the recent high level of trader hedging.
That said, from a sentiment basis, it is still a bit difficult to depend on stocks bouncing and the VIX dropping from here. We have attempted to isolate historically similar moves to what we just witnessed in the VIX. To the extent that these historical comparisons are applicable, stocks should rebound some in the short to intermediate-term. Even more so, the VIX should be expected to retreat over that time frame. However, when dealing with truly unprecedented events, it is difficult to hang one’s hat on an “expected” outcome.
Conclusion
All of our analysis over the past 12-18 months has been consistent with our expectations of a significant cyclical top developing in the broad stock market. The post-2000 secular excesses that remained inadequately repaired appear poised, in our view, to undergo that process. At the same time, bull market tops can be long, drawn-out processes. And the more substantial the top, the more drawn-out the process can be. Thus, the timing of a market top is one of the more difficult challenges for an investor.
This point has been driven home during the post-February bounce in the stock market. The cyclical top appeared to be unfolding remarkably on schedule following the internal market deterioration last year, and the subsequent breakdown in prices into early 2016. However, one has to always maintain an open mind regarding the potential movement in financial markets. As such, the quality of the expected “bear market rally” off of the February lows has exceeded our relatively moderate expectations. The breadth has for the most part been excellent, the momentum very good and sentiment constructively skeptical. All of those factors have produced a more impressive rally than we would have predicted in mid-February.
So how much of the elevated expectations due to the high-quality nature of the rally have been realized? From a market breadth perspective, the new high in the NYSE Advance-Decline line should give one pause about ruling out a new high in stocks, at least in the S&P 500. That said, our research has just recently begun to detect the first cracks in the previously superb breadth situation. In terms of momentum, the reliablebullish expectations based upon the thrust off of the February low have likely run their course. That said, a further extension of the rally based on similar historical thrusts cannot be ruled out, and indeed is probably as likely to occur as not. Much of that may depend on the key tests in those former laggard groups that provided an extra boost to the rally in recent months. And from a sentiment standpoint, there is substantial upside potential based on still-depressed readings. However, that potential will only pay dividends if it becomes realized and market participants begin to become more bullish.
Our expectations of a developing significant market top have not changed as a result of the impressive post-February rally. The bounce, in our view, is likely still consistent with a “bear market rally”. Thus, while it may extend further still, it is unlikely to be sustainable in the end. In legal terms, a “stay of execution” is defined as “a delay in carrying out a court order”. It does not terminate the order. As such, while the ultimate demise of the bull market may have been postponed temporarily, it is still on schedule for slaughter.
Dana Lyons
Partner
Copyright (C) 2016 J. Lyons Fund Management, Inc. All rights reserved.
The commentary included in this newsletter is provided for informational purposes only. It does not constitute a recommendation to invest in any specific investment product or service. Proper due diligence should be performed before investing in any investment vehicle. There is a risk of loss involved in all investments.
Twitter: @JLyonsFundMgmt
Read more from Dana’s Tumblr Blog
Any opinions expressed herein are solely those of the author, and do not in any way represent the views or opinions of any other person or entity.


: Showing Some Signs of Emerging Strength")
