Breaking Bad: Anatomy Of A Market Top – Part 2
The last and most important bastion of the cyclical bull market in U.S. stocks — price — has finally broken down.
The following first appeared as the March 2016 edition of the J. Lyons Fund Management, Inc. Newsletter at www.jlfmi.com.
“Once the relatively few leaders propping up the market begin to collapse…the inevitable cyclical decline can commence. That is when Part 2 occurs: breakdown of prices. This looks to be unfolding as we speak, so stay tuned…” – Conclusion from August 2015’s ‘Internal Combustion, Anatomy Of A Market Top – Part 1’
For some time now, we have been detailing a steadily expanding litany of concerns regarding the longer-term prospects of the U.S. stock market. These concerns have generally revolved around ancillary factors relative to stock prices. Such factors include metrics pertaining to valuation, sentiment, investor allocation, investment leverage, corporate profligacy and so on. These are what we call background indicators, as opposed to actionable signals. They represent big-picture market conditions from which longer-term stock market expectations can most reasonably be formed.
One might think of these background conditions as measures of the market’s prevailing potential risk. And based on recent readings, the potential risk as expressed through these background indicators could hardly be greater. As such, they currently signify circumstances from which stocks have historically experienced subpar longer-term returns. Furthermore, on a secular basis, these background indicators typically cycle from extreme excess at a secular stock market top (e.g., 2000) to extremely depressed at a secular low. Intensifying the current longer-term risk is the fact that these indicators never fully corrected their secular excesses during the post-2000 bear market.
That background synopsis represents the informal, unwritten first part of our ‘Anatomy Of A Market Top’ series — call it Part Zero, if you will. Probably the closest piece to a formal discussion on this topic is our May 2014 Newsletter (in Part 1, we incorrectly suggested it was the October 2013 edition). In the August 2015 Newsletter, we issued the formal Part 1 of the ‘Anatomy Of A Market Top’ series, titled “Internal Combustion”. In it, we detailed the systematic deterioration in the internals of the stock market that had been developing for the better part of 2015. At the time, this trend had begun to reach depths historically seen only near major market tops. And yet, the major stock averages continued to persist near all-time highs.
There remained just one missing ingredient in transposing the potential risk posed by the background landscape and internal deterioration into manifested risk: a break in prices. And for all of the ominous looking conditions represented by the aforementioned factors, the single factor most vital in supporting the persistence of the bull market had continued to be constructive. That is price. Price is the one thing that has the ability to trump all of the ancillary concerns that we have laid out. And over the past several years it has, vaulting the bull market to levels that were, by some measures, unprecedented in history.
Stock market bulls — both the reasonable as well as the “perma” species — pointed to this resiliency in price as evidence to support their market stance. And while many bulls stubbornly refused to acknowledge the gathering risks indicated by both the background conditions and the internal deterioration, they were correct about price — at least as it pertained to the major cap-weighted averages. Unfortunately for investors, that appears to have changed. This last, most crucial support piece of the bull market has finally given way as prices are breaking bad. As we illustrate in this piece, Part 2 has arrived.
Disclaimer: While this study is a useful exercise, JLFMI’s actual investment decisions are based on our proprietary models. Therefore, the conclusions based on the study in this newsletter may or may not be consistent with JLFMI’s actual investment posture at any given time. Additionally, the commentary here should not be taken as a recommendation to invest in any specific securities or according to any specific methodologies.
Like most market analysis, a price “breakdown” is a subjective thing. Therefore, in an effort to lay out our breakdown case in the most broadly receivable way, we present the following charts in a basic, almost Neanderthal manner. Per Einstein and Occam’s razor, simpler is better anyway, right? So, what are the most elementary determinants of a break in a price uptrend? How about a break of an up-sloping trendline and a series of lower highs and lower lows? That’s about as basic and uncontroversial as it gets. It’s so clear, a caveman can see it. If perma-bulls cannot recognize the blow that prices have been dealt over the past few months by viewing the following charts, there may be no getting through to them.
Below is but a sampling of key equity indices that have suffered potentially fatal bull market blows, based (mostly) on the aforementioned primitive standards. These may not all be the most popular of indices, but they were chosen because, in our view, they best represent the true trend of the equity market. (Some of the charts are as much as a month old and have seen prices recover some; however, the damage has already been done, in our view.)
Value Line Geometric Composite
The Value Line Geometric Composite is an unweighted index of approximately 1700 stocks that essentially measures the median stock performance among the universe. As such, it is our favored index in instructing us as to the true health of the U.S. equity market. And based on recent events, the market’s longer-term health has taken a turn for the worse.
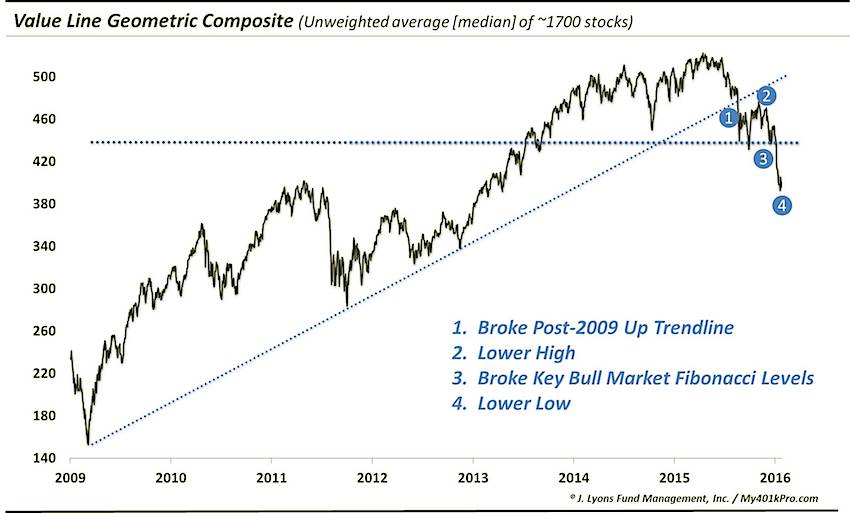
As the chart shows, the action over the past few months has resulted in the following breaking developments in the Value Line Geometric Composite:
- It broke its post-2009 Up trendline
- It has formed a lower high
- It broke key Fibonacci Retracement lines pertaining to the post-2009 bull market
- It has formed a lower low
That, my friends, is the definition of a downtrend.
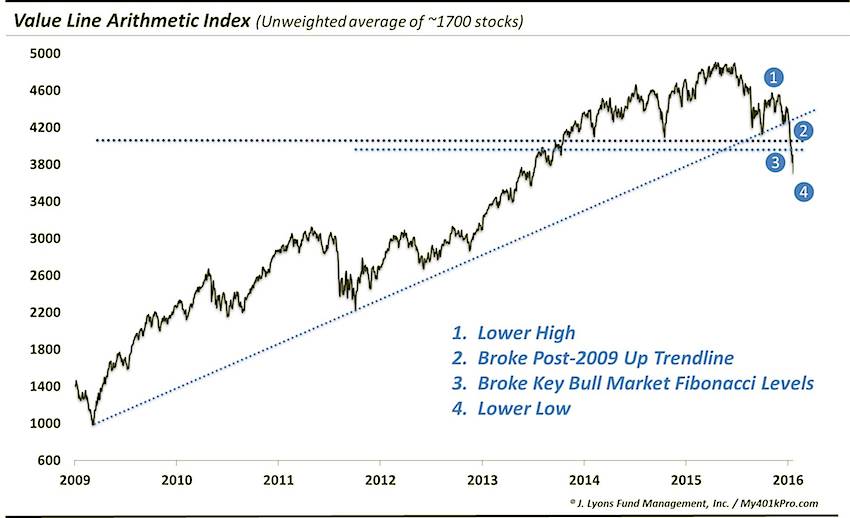
Value Line Arithmetic Index
Similar to its Geometric sister, the Value Line Arithmetic Index essentially measures the average stock performance among the equally-weighted 1700 stocks. Also similar is the fact that its uptrend has broken.
continue reading on the next page…


