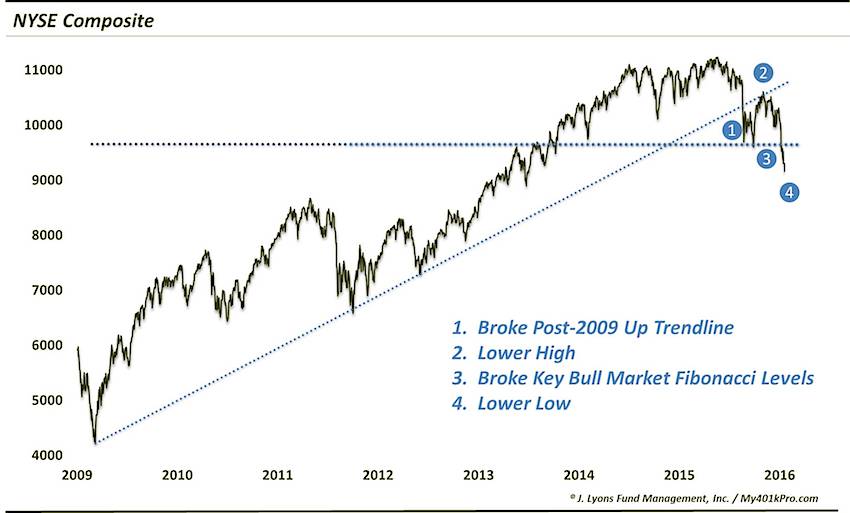
NYSE Composite
Another of the broadest stock market gauges, encompassing some 2000 securities, is the NYSE Composite. Like the Value Line Indices, the NYSE’s uptrend has broken down based on the same basic criteria.
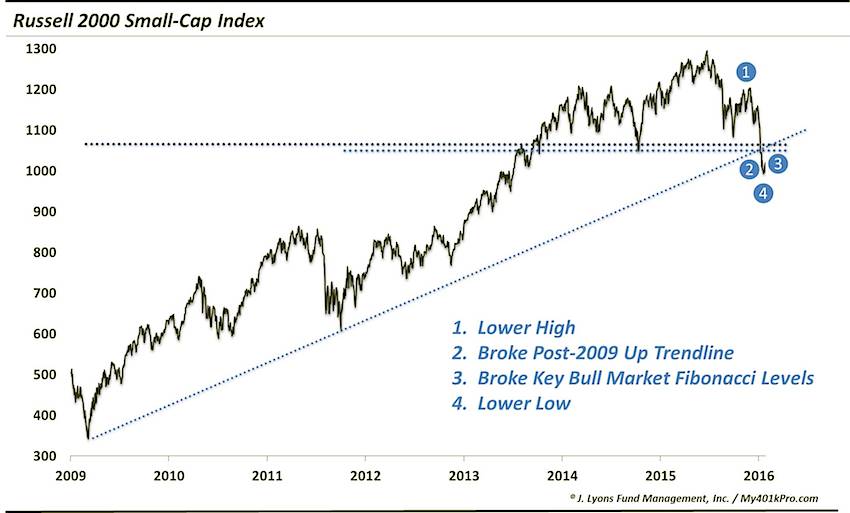
Russell 2000 Index
Similarly, one of the broader, high-beta areas of the market has also broken down: small-caps. These stocks typically represent the “risk-on/risk-off” situation in the market. And judging by the Russell 2000, the environment has definitely switched to risk-off.
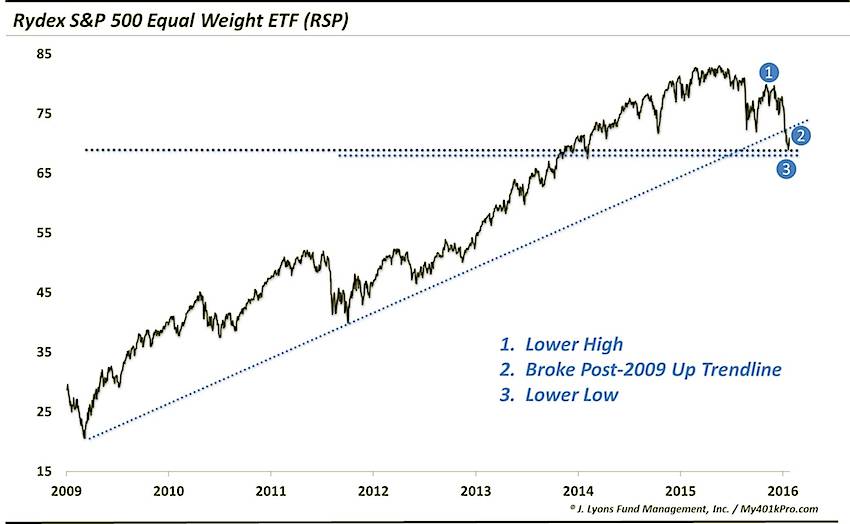
S&P 500 Equal-Weight Index
It is not just the laggards that broke their uptrends either. The large-cap space, which had held up the best (albeit on the back of a thinning number of mega-cap stocks), has also succumbed to breaking prices — if you measure it correctly. Witness the action in the equal-weight S&P 500 ETF (ticker, RSP).
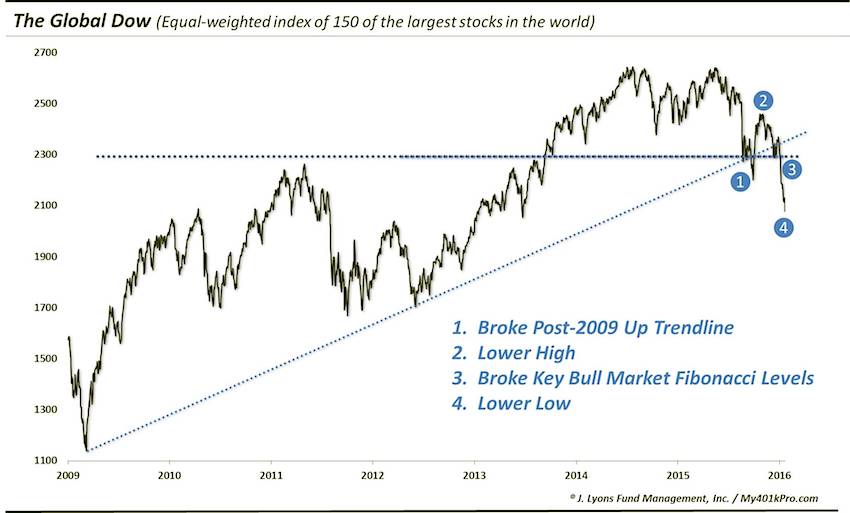
The Global Dow
Our focus here is mostly on the U.S. equity market and cycle. However, the financial world is increasingly flat and when one market breaks, the cracks tend to extend to other markets as well. Thus, in addition to the U.S. indices breaking bad, global and international markets have also exhibited similar characteristics of markets that have topped out. One example is the Global Dow Index, which is an unweighted average of 150 of the largest stocks in the world.
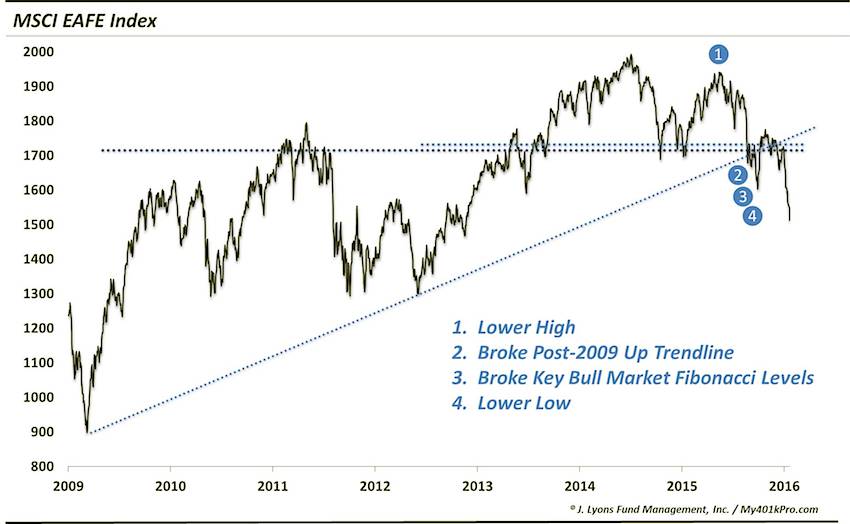
MSCI EAFE Index
Perhaps the most widely watched international composite is the MSCI EAFE Index of developed markets. Here too, one can easily see the hallmarks of a broken uptrend.
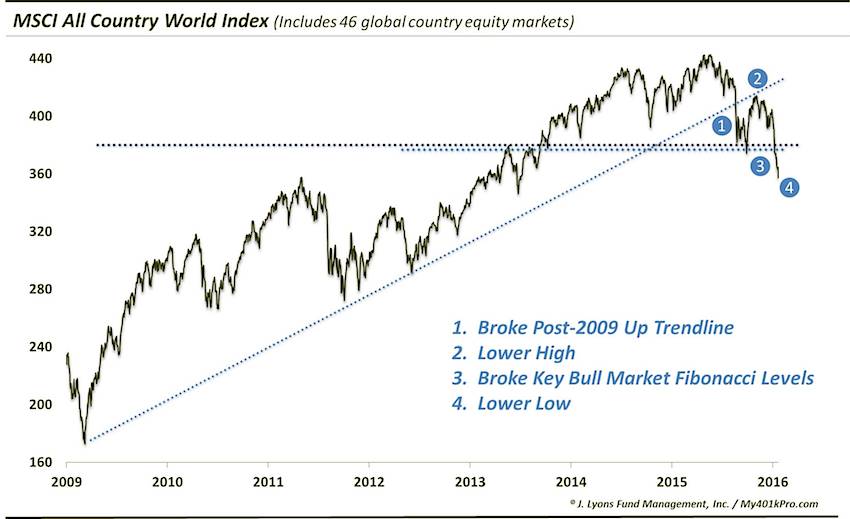
MSCI All Country World Index
It is the same story with one of the broadest global equity indices, the MSCI ACWI. The ACWI includes 46 country equity markets from around the globe. Judging by this index, the global equity bull market has most certainly been broken.
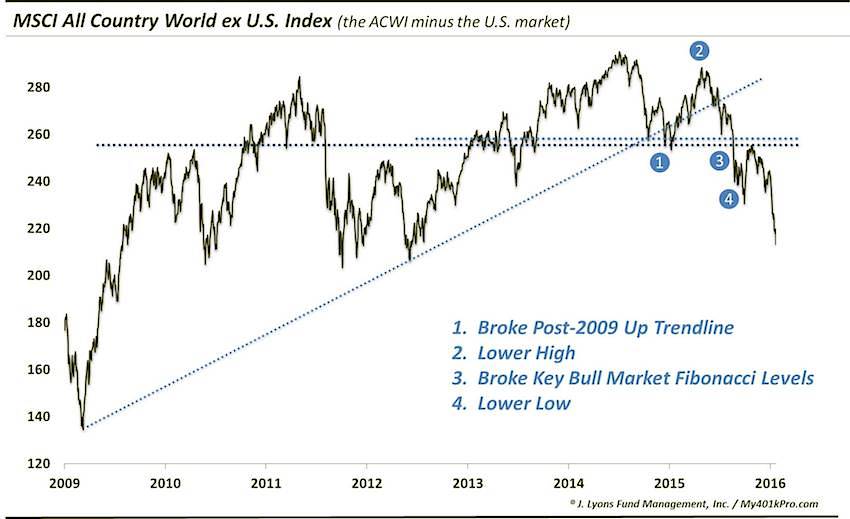
MSCI All Country World Index ex U.S.
As most investors probably know, the U.S. equity market was one of the last world markets to succumb to the recent selling pressure. Thus, the brokenness of the ACWI chart above has little to do with U.S. stocks. Lest anyone think any differently, take a peek at the MSCI All Country World ex U.S. Index. It is exactly what the name implies: the 45 countries in the ACWI besides the U.S. This one has been broken for a while now.
We could certainly show many more examples of indices whose post-2009 cyclical uptrends have clearly and decisively been broken. However, that would be redundant. We have selected what we feel are the most instructive indices in revealing the true trend of the broad market. We’re not talking about the Sri Lankan Stock Market here, or the Dow Jones U.S. Waste & Disposal Services Index. We’re talking about the broadest, most important indices in the U.S. and the world. And unanimously, the message is that the uptrend is over.
What Does This Mean?
Before jumping to conclusions, let’s discuss what these broken markets mean. Let’s again keep things simple: it means that the post-2009 cyclical bull market for most stocks has likely topped. The broad uptrend has been clearly broken and, therefore, one should not be investing, or trading, under the assumption that the bull market is still intact. Importantly, that means do not expect the series of higher lows and higher highs — with unlimited upside — to be the case for the foreseeable future.
What Does This NOT Mean?
Just as importantly, what does this broken uptrend not mean to markets? First off, it does not necessarily mean that a severe bear market must follow, either in time or price depreciation. The period subsequent to this cyclical market top will semantically be referred to (by some) as a cyclical bear market. However, that can take many forms.
The market may indeed suffer a prolonged bear market, delivering substantial losses to investors, ala 2000-2002 and 2007-2009. On the other hand, it may also be merely a period of digestion or consolidation during which the market takes a “breather” from its bull run, but suffers relatively little in the way of losses. Additionally, even if a major bear market is in the offing, it will not be a one-way, straight shot to the floor. There will be starts and stops along the way, with a fair share of sharp rallies, such as the ripper currently underway. Furthermore, it is certainly not implausible to think that some of the leading indices may yet make new highs as the market transition evolves.
The main point is that identifying a stock market top is different than forecasting a severe bear market.
What Do We Think This Means?
Our comprehensive research suggests there is great risk of a severe bear market. First, the extent of the deterioration in market internals that we documented last year have, without exception, led to extensive cyclical bear markets. Yes, the breadth divergences can persist for a while, but once prices break, there has been no more putting off the inevitable. And prices have broken as we demonstrated. Probably the closest comparisons to the internal damage that we witnessed last year preceded the cyclical market tops in 1973 and 2000. Each preceded 50% declines in the S&P 500.
Perhaps even more concerning is the situation surrounding the background indicators mentioned in the introduction. These factors, such as price:long-term trend, valuation and household stock allocation never fully worked off the excesses that were built up into the 2000 secular top. Furthermore, these types of metrics have always cycled to the opposite extreme prior to the launch of the next sustainable secular bull market. Not only have these background indicators not fully worked off their secular bull market excesses, but they are now back closer to excessive extremes — with some measures even exceeding prior cyclical peaks.
In order for these indicators to truly work off their excessive readings, not to mention move them to extreme levels to the downside (where we expect them to eventually end up) it will likely take substantial market losses or a substantial amount of time without positive returns — or likely both.
Conclusion
When 2015 began, the potential risk of a developing cyclical top in the stock market was considerable, based on longer-term background metrics such as valuation, sentiment, investor allocation, etc. However, stock market bulls pointed to the indices which continued to move higher in spite of the risk. 6 months later, an almost unprecedented deterioration in the internals had left the market foundation weaker still and the prospects of a stock market top even greater. Still, bulls pointed to the strength in the large-cap, weighted indices which remained the last buoyant holdouts on the backs of a few mega-cap stocks.
Finally, beginning shortly after that in August, the final bastion of the bull market began to fall: prices. And the escalation of the decline to begin 2016 left little doubt, based on the most basic of trend analyses that we have highlighted here, that the market’s cyclical uptrend had been broken. No, this does not guarantee that a severe bear market will necessarily unfold, though we think it will. The point is that the post-2009 bull market is, in all likelihood, over.
Perma-bulls are fond of saying price is truth. We agree. But if they cannot acknowledge the clear and decisive breakdown in stock prices now, perhaps they simply cannot handle the truth.
The commentary included in this newsletter is provided for informational purposes only. It does not constitute a recommendation to invest in any specific investment product or service. Proper due diligence should be performed before investing in any investment vehicle. There is a risk of loss involved in all investments.
Twitter: @JLyonsFundMgmt
The author or clients have position in mentioned or related securities at the time of publication. Any opinions expressed herein are solely those of the author, and do not in any way represent the views or opinions of any other person or entity.


