The closely-followed iShares Biotechnology ETF (IBB) continues to show technical deterioration following it’s mini-blowoff in late June/early July to complete a 4-month Bearish Bat harmonic pattern near $266.
Over the last 4 weeks, IBB – amidst a broader environment justifiably referred to as “manic” or “bubbly” – has built out a Head & Shoulders Top pattern from which it has broken down during Wednesday’s session in trade below its neckline near $250.
Among all classic technical patterns, perhaps none is more well known or subjected to debate over it’s efficacy than the Head & Shoulders pattern. In this instance, the construction is symmetrical and uniform, with a neckline break that comes after IBB as succumbed to renewed selling pressure below 2014’s price fulcrum near $253. Footholds to watch for are those given off by June’s continuation bull flags at $245 and again at $240. As with any pattern, whether it is traded profitably is a function of entry and effective risk management around possible reversal levels prior to it’s main price objective, with almost nothing to do with the quantitative measures of objective efficacy to which these patterns are often subjected in academic study.
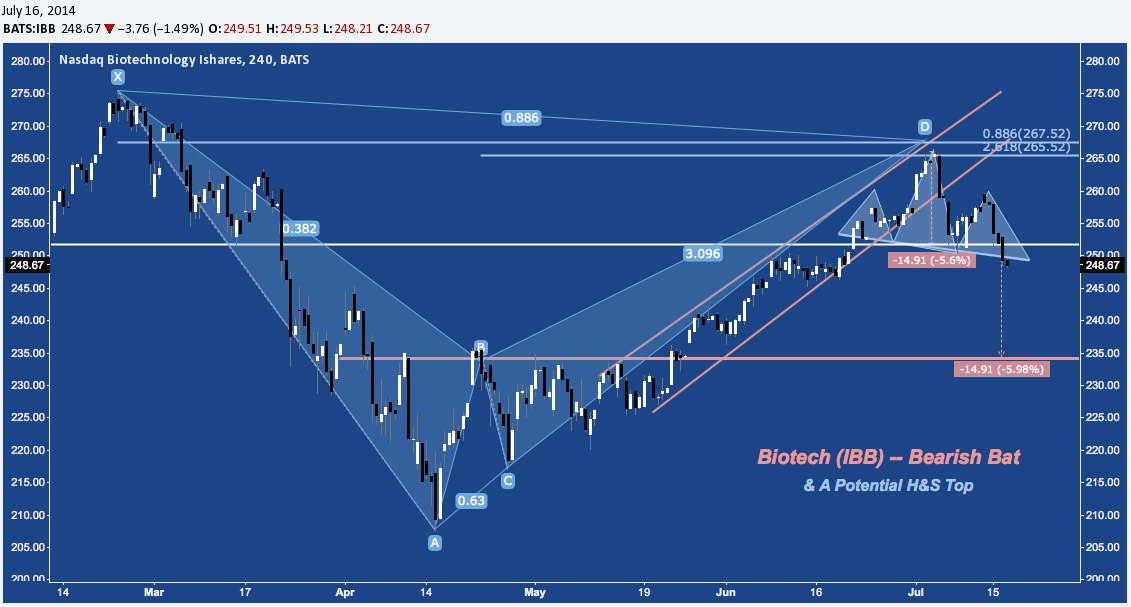
Today’s session marks the 6th consecutive down day for IBB, an uncommonly persistent Biotech sell off matched only twice in the last year – early October 2013, late April 2014 – and only exceeded only once during April’s 8-session drop (from point B to point C, below). Coming at the nadir of a -6.75% drop from it’s 07/03/2014 high some reprieve in the next session or two is likely.
Assuming IBB holds below $253-$255, however: the now-active H&S Top and Bearish Bat align to imply a measured move down to $235, the site of horizontal support/resistance in March-May at the Bat’s point B.
Twitter: @andrewunknown and @seeitmarket
Author holds no exposure to instruments mentioned at the time of publication. Commentary provided is for educational purposes only and in no way constitutes trading or investment advice. Helix image courtesy of Monster.com


 Ready To Break Out?")


 Ready To Break Out?")