In the category of market defeat snatched from the jaws of victory, the super-heated Biotech industry is showing early signs of relapsing into the technically challenged behavior it briefly displayed back in the Spring. One of the “Charts to Watch During the Summer Doldrums“, the iShares NASDAQ Biotechnology ETF (IBB) is proving to be anything but dull, shedding over -5% in this week’s first two days of trading.
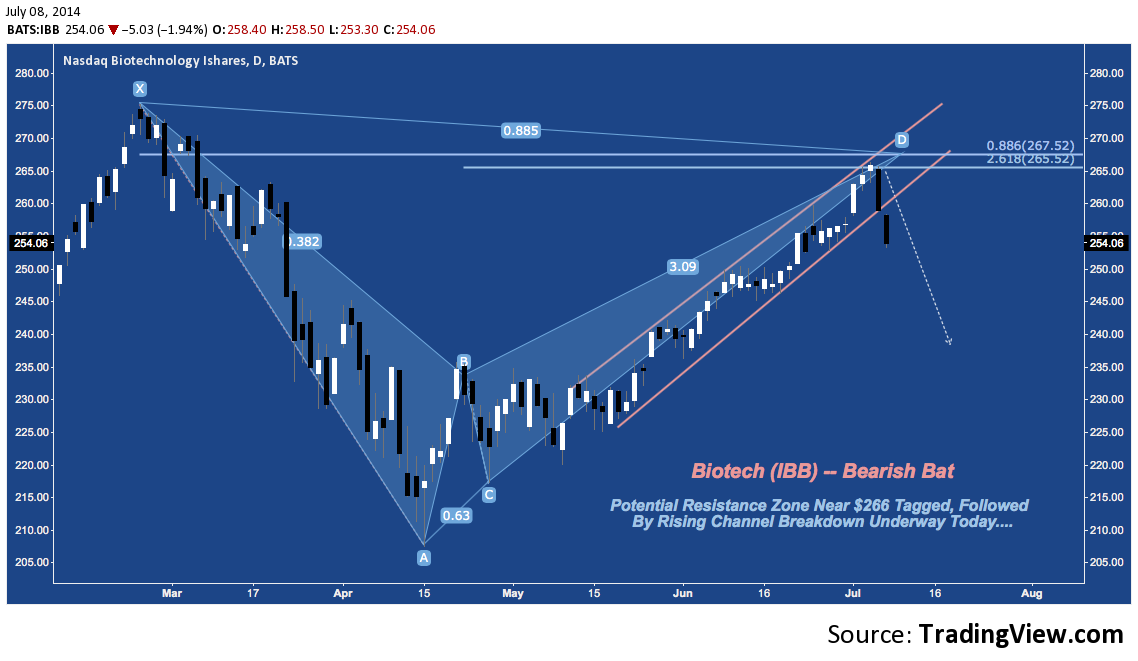
IBB’s 6 week collapse earlier this year carried the cap-weighted benchmark ETF to it’s 200-Day SMA near $210 where it briefly consolidated before bouncing in mid-April. In the 3 months since, IBB advanced nearly 25%, reaching a high just above $266 last Thursday, July 3rd (at D, below) – less than 4% below February’s all-time high near $275 (at X).
This almost-complete 4.5 month round trip on IBB built out a Bearish Bat harmonic pattern, denoted by the fibonacci 38.2% retracement of the sell off (at B) in late April and a full 88.6% retracement (at D) into last Thursday at the pattern’s Potential Reversal Zone (PRZ) between $265-$267. Yesterday’s sell-off put the advance on its heels with a -2.6% dive to 2-month rising channel support. Now today’s tentative followthrough below the channel is adding confirmation, suggesting the ETF may once again be headed significantly lower.
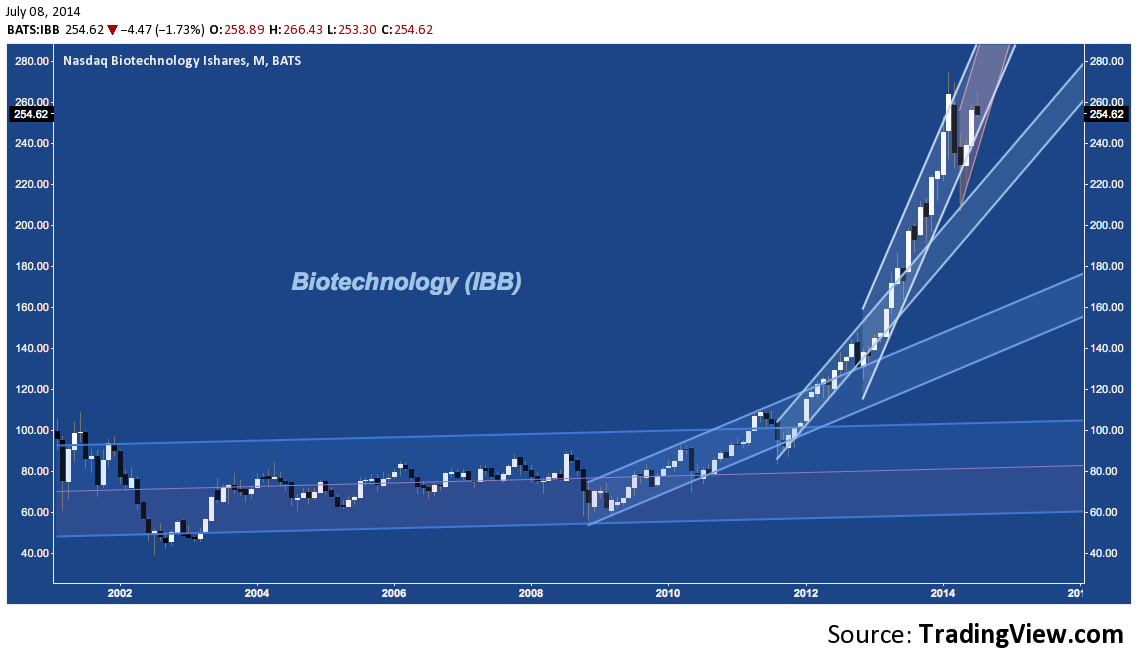
This comes at an interesting time for Biotech. The US IPO window has been wide open for awhile, admitting 53 Healthcare IPOs in 2014 YTD to already exceed the highest full-year total (50 in 2004) of at least the last 10 years. The observations about the speculative IPO fervor running amuck in the Biotech space we offered in March are relevant as ever as interest is redoubled with IPO filings setting the primary market on a pace that truly rivals 1999 in quantity of deals (227 YTD v. 480 total) and proceeds ($31.5B from 148 IPOs v. $63B total). Every would-be apothecary with a mortal & pestle and a Certificate of Completion in Natural Health Remedies they bought off Craiglist is being tracked down by syndicate bloodhounds to go public. As a result, we have a long-term chart that looks like this:
FDA fast-tracking, accelerated approvals, advances in genomics, eager underwriters: they’re all fantastic with judicious application, which is still happening in isolated pockets; but no market is ever so “disrupted” over so concise a time frame that a near-parabolic industry-wide price trajectory like this one becomes sustainable.
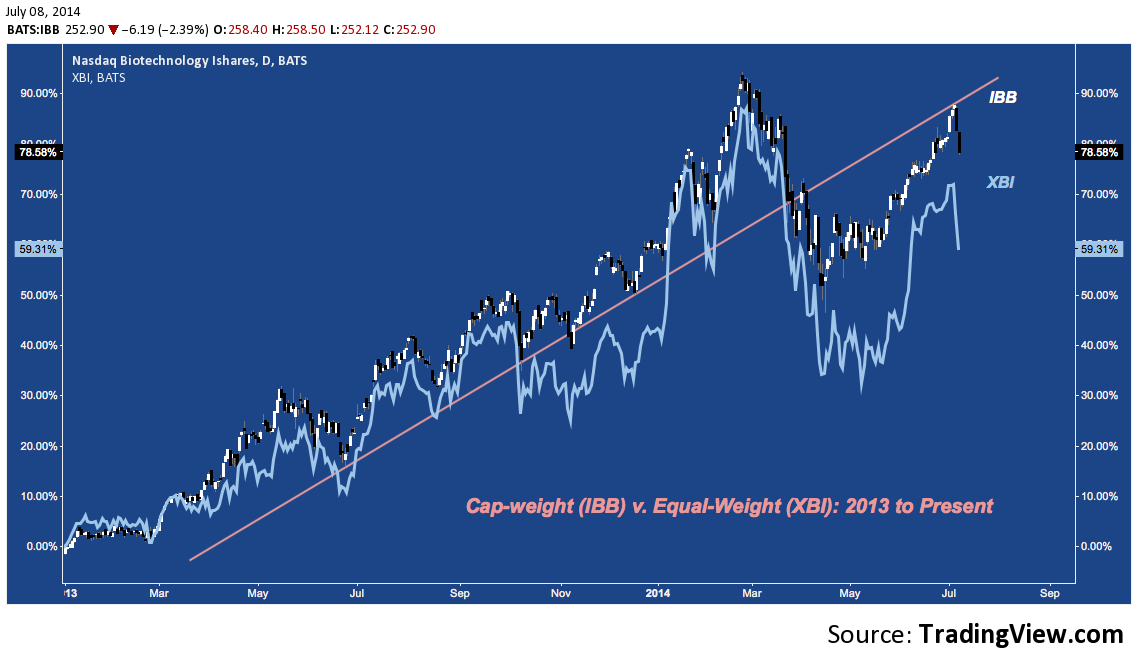
Since this manic IPO period got underway at the end of 2012/beginning of 2013 larger and smaller (which includes IPOs) Biotechs have traded off as relative strength leaders. Where larger companies have taken the lead, the cap-weighted IBB has outperformed the industry’s equal-weight SPDR Biotech ETF (XBI). Since the low in mid-April, IBB has significantly outperformed XBI, suggesting the veneer of restored enthusiasm for speculative Biotech after the Spring’s cliff-dive may not be much more than a powerful bear market rally.
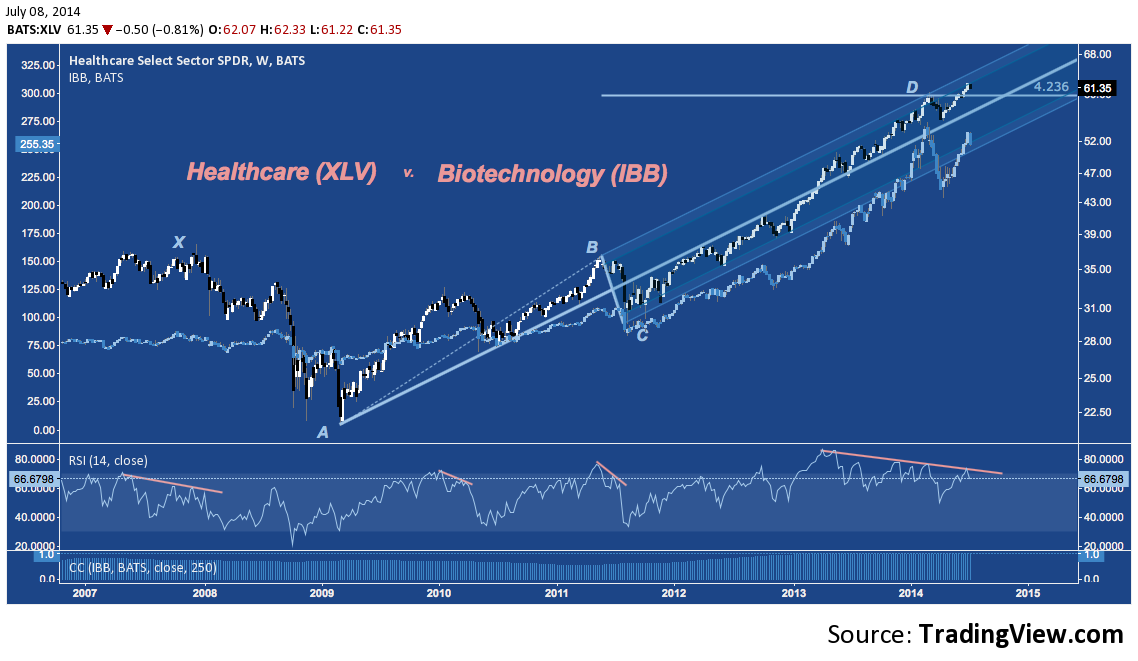
What does Biotech’s larger sector context have to say? As a facet of the larger Healthcare Sector (represented here by the SPDR Healthcare Select Sector ETF, XLV), IBB moves in exact lockstep with XLV with a long-term positive correlation of 1. As it happens, XLV has spent most of 2013 and 2014 YTD stalling at major multi-year ABCD resistance near $61 and pushing higher with decreasing momentum against it’s post-2009 Andrew’s Pitchfork upper reaction line (near D, below). Note the lengthy negative momentum divergence that has developed on XLV over this timeframe (see RSI in lower panel).
One can debate whether or not it’s a case of the tail wagging the dog, but so far IBB – largely responsible for driving XLV’s out-performance of the broader S&P 500 over the last 1.5 years – has not confirmed XLV’s higher high in 2014. If this non-confirmation takes hold in the form of a sustained move lower off IBB’s Bearish Bat, XLV itself may finally consummate a reversal at D and see it’s first material correction since mid-2011.
Twitter: @andrewunknown and @seeitmarket
Author holds no exposure to instruments mentioned at the time of publication. Commentary provided is for educational purposes only and in no way constitutes trading or investment advice.


