July 4th – June 6th – September 11th – August 15th
You likely associated the first three dates above with transformative events in U.S. history (and U.S. economic history). August 15th, however, may have you scratching your head.
August 15, 1971 was the date that President Richard Nixon shocked the world when he closed the gold window, thus eliminating free convertibility of the U.S. dollar to gold. This infamous ‘new economic policy’, or “Nixon Shock”, thereby removed the requirement that the U.S. dollar be backed by gold reserves. From that fateful day forward, constraints were removed that previously hindered the Federal Reserve’s (Fed) ability to manage the U.S. money supply. Decades later, slowing economic growth, nonexistent wage growth, growing wealth disparity, deteriorating productivity growth and other economic ills lay in the wake of Nixon’s verdict. August 15 remembers a day that the course of U.S. economic history was altered.
The Transformation of the Federal Reserve and Alan Greenspan
With the stroke of President Nixon’s pen a new standard of economic policy was imposed upon the American people and with it came promises of increased economic growth, high levels of employment and general prosperity. What we know now, almost 50 years later, is that unshackling the U.S. monetary system from the discipline of a gold standard, allowed the Fed to play a leading role in replacing the Virtuous Cycle with an Un-Virtuous Cycle. Eliminating the risk of global redemption of U.S. dollars for gold also eliminated the discipline, the checks and balances, on deficit spending by the government and its citizens. As the debt accumulated, the requirement on the Federal Reserve to drive interest rates lower became mandatory to enable the economic system to service that debt. And this effectively changed the course of U.S. economic history.
In this new post-1971 era, the Fed approached monetary policy in a pre-emptive fashion with increasing aggression. In other words, the Federal Reserve, more often than not, forced interest rates below levels that would likely have been prevalent if determined by the free market. The strategy was to unnaturally mitigate even minor and healthy economic corrections and to encourage more public and private borrowing to drive consumption, indirectly discouraging savings. The purpose was to create more economic growth than there would otherwise have been.
This new and aggressive form of monetary policy is epitomized by the transformation of Federal Reserve Chairman Alan Greenspan. Greenspan came into office in 1987 as an Ayn Rand disciple, a vocal supporter of free-markets. Beginning with the October 19, 1987 “Black Monday” stock market crash, however, he began to fully appreciate his ability to control interest rates, the money supply and ultimately economic activity. He was able to stem the undesirable effects of various financial crises, and spur economic growth when he believed it to be warranted. Greenspan converted from a free market activist, preaching that markets should naturally set their own interest rates, to one promoting the Fed’s role in determining “appropriate” levels of interest rates and economic growth.
In 2006, after 18 years as Chairman of the Federal Reserve and nicknamed “The Maestro”, he retired and handed the baton to Ben Bernanke and Janet Yellen, both of whom have followed in his active and aggressive monetary policy ways.
Proof
The Federal Reserve’s powerful effect on interest rates made it cheaper for households and government to borrow and spend, and therefore debt was made more attractive to citizens and politicians. Personal consumption and government spending are the largest components of economic activity, accounting for approximately 70% and 20% of GDP respectively.
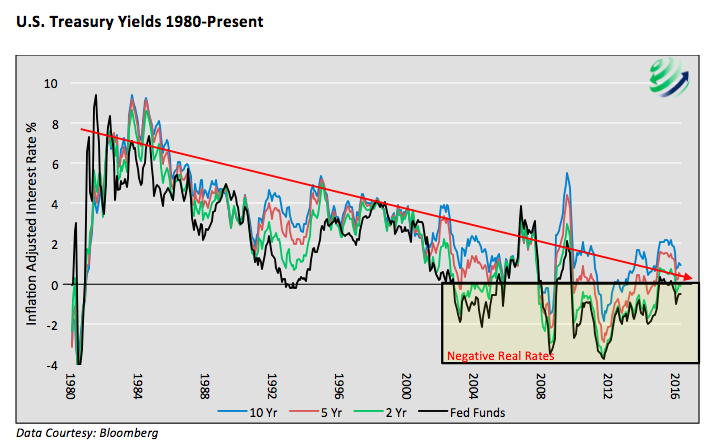
The following graph illustrates the degree to which interest rates across the maturity curve became progressively more appealing to borrowers over time. The graph below shows inflation-adjusted or “real” U.S. Treasury interest rates (yields) to provide a clear comparison of interest rates through various inflationary and economic periods. Since 2003, many of the data points in the graph are negative, creating an environment which outright penalizes savers and benefits borrowers.
The next graph tells the same story but in a different light. It compares the Federal Funds rate (the Fed controlled interest rate that banks charge each other for overnight borrowing) to the growth rate of economic output (GDP). This comparison is based on a theory proposed by Knut Wicksell, a 19th century economist. In the Theory of Interest (1898) he proposes that there is an optimal interest rate. Any interest rate other than that rate would have negative consequences for long term economic growth. When rates are too high and above the optimal rate, the economy would languish. Conversely, lower than optimal rates lead to over-borrowing, capital misallocation and speculation eventually resulting in economic hardships. To calculate the optimal rate, Wicksell used market rates of interest as compared to GDP. Here’s a look at the latest slice of U.S. economic history.
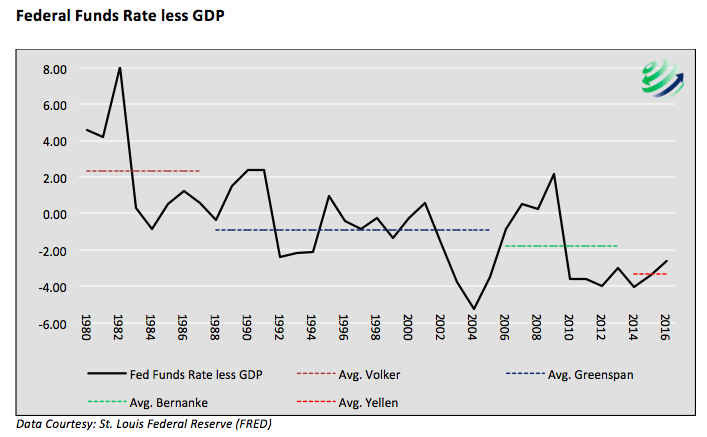
In order to gauge the direct influence the Fed exerted on interest rates within Wicksell’s framework we compare the Fed Funds rate to GDP. Like the prior graph, notice the declining trend pointing to “easier” borrowing conditions. Additionally, note that since 2000 the spread between Fed Funds and GDP has largely been negative. As the spread declined, borrowers were further lead to speculation and misallocated capital, exactly what Wicksell theorized would occur with rates below the optimal level. The tech bubble, real-estate bubble and many other asset bubbles provide supporting evidence to his theory.
The Smoking Gun
The graphs above make a good case that the Fed has been overly-aggressive in their use of interest rate policy to increase the desire to borrow and ultimately drive consumption. We fortify this claim by comparing the Federal Reserve’s monetary policy actions to their congressionally set mandate to erase any doubt you may still have. The following is the 1977 amended Federal Reserve Act stating the monetary objectives of the Fed. This is often referred to as the dual mandate.
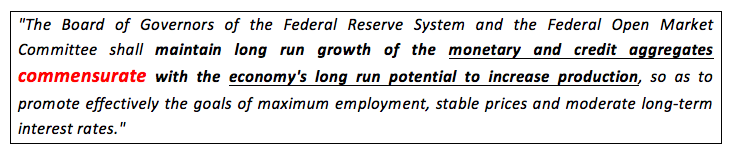
To paraphrase – the Federal Reserve should allow the money supply and debt outstanding to grow at a rate matching the potential economic growth rate in order to help achieve their mandated goals.
Since 1977, the year the mandate was issued, the annualized growth rate of credit and the monetary base increased at over twice the rate of the economy’s potential growth rate (productivity + population growth). The two measures rose annually 42% and 65% respectively faster than actual economic growth.
Commensurate is not a word we would use to describe the relationships of those growth rates to that of the economy’s potential growth rate!
The Hangover
In a Virtuous Cycle, saving and investment lead to productivity gains, increased production growth and ultimately growing prosperity which then further perpetuates the cycle. In the Un-Virtuous Cycle, debt leads to consumption which leads to more debt and more consumption in a vicious self-fulfilling spiral. In the Un-Virtuous Cycle, savings, investment and productivity are neglected. Declining productivity growth causes a decline in the potential economic growth rate, thus requiring ever-greater levels of debt to maintain current levels of economic growth.
continue reading on the next page…

 Flirting With Critical Support… Again")


