This debt trap also requires ever lower interest rates to allow the growing mountain of debt to be serviced.
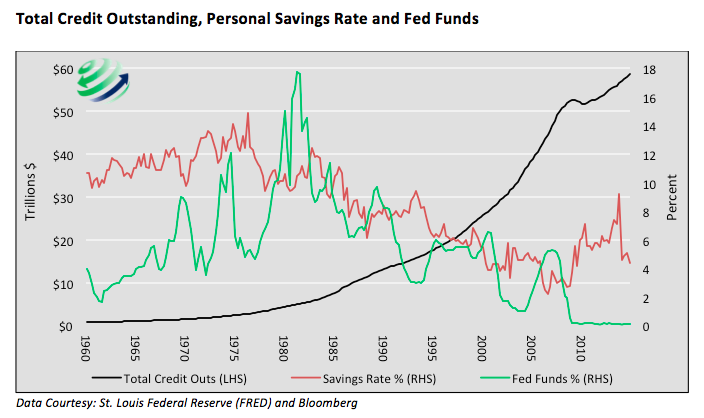
With almost 50 years of history there is sufficient data to judge the effects of the Federal Reserve’s monetary policy experiment. The first graph below highlights the exponential growth in debt (black line) which coincided with the decline in the personal savings rate (orange) and the Fed Funds rate (green).
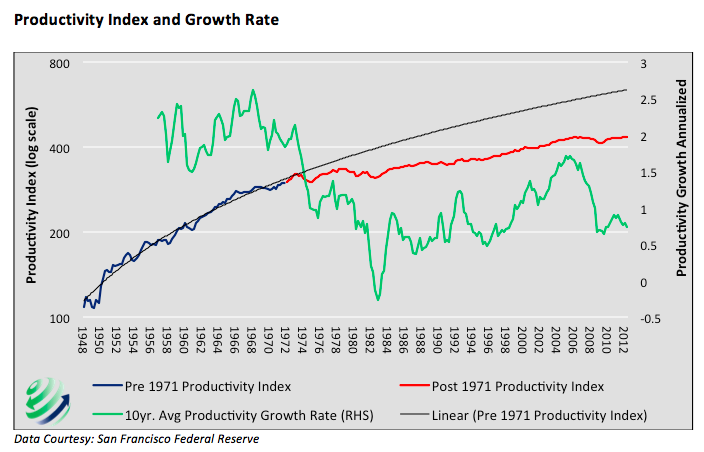
As the savings rate slowed, investment naturally followed suit and, as the Virtuous Cycle dictates, productivity growth declined. The graph below highlights the decline in the productivity growth rate. The dotted black line allows one to compare the productivity growth rate prior to the removal of the gold standard to the period afterwards. The 10-year average growth rate (green) also highlights the stark difference in productivity growth rates before and after the early 1970’s. Please note, the green line denotes a ten-year average growth rate. Recent readings over the prior two years and other measures of productivity are very close to zero.
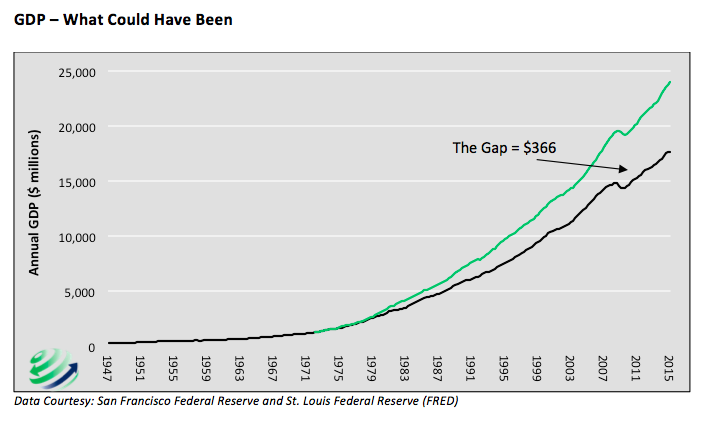
Over the long term, economic growth is largely a function of productivity growth. The graph below compares GDP to what it might have looked like had the productivity growth trend of pre-1971 continued. Clearly, the unrealized productive output would have gone a long way toward keeping today’s debt levels manageable, incomes more balanced across the population and the standard of living rising for the country as a whole.
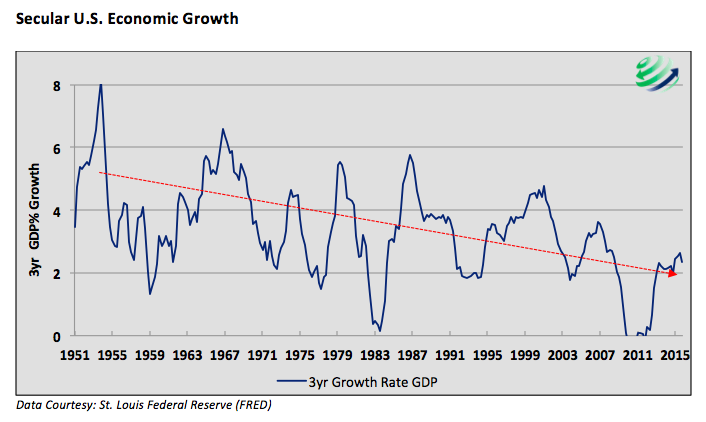
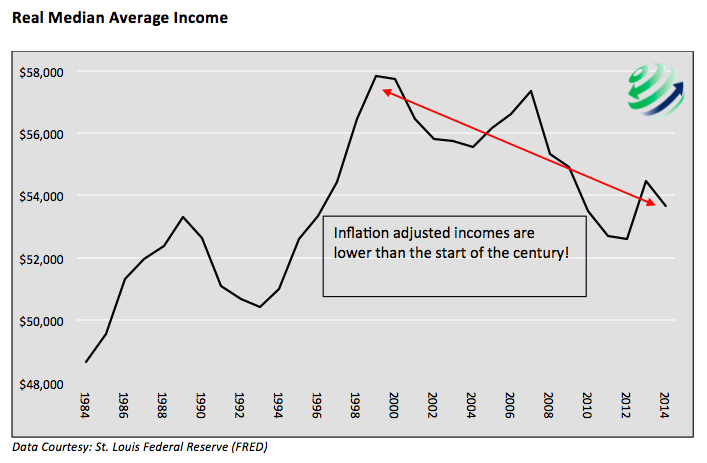
The graphs below show the secular trend in economic growth and the lack of real income growth over the last 20 years.
A Feeble Rebuttal
Some may contend that debt was not only employed to satisfy immediate consumption needs but also used for investment purposes. While some debt was certainly allocated toward productive investment, the data clearly argues that a large majority of the debt was either used for consumptive purposes or was poorly invested in investments that were unsuccessful in increasing productivity. Had debt been employed successfully in productivity enhancing investments, GDP and productivity would have increased at a similar or greater pace than the rise in debt. Here’s a stat for U.S. economic history:
In the 1970’s $1.66 of new debt created $1.00 of economic growth. Since that time, debt has grown at three times the rate of economic activity and it now takes $4.47 of new debt to create the same $1.00 of economic growth.
Summary
August 15, 2016 will mark the 45th anniversary of President Nixon’s decision to close the gold window. U.S. citizens and the government are now beholden to the consequences of years of accumulated debt and weak productivity growth that have occurred since that day. Now, seven years after the end of the financial crisis and recession, these consequences are in plain sight. And it’s clear that this era will go down in U.S. economic history.
The Federal Reserve currently finds themselves crippled under an imprudent zero interest rate policy. They are unable to raise interest rates due fear of stoking another crisis. Worse, other central banks, in a similar quest to keep prior debt serviceable and generate even more debt induced economic growth, have pushed beyond the realm of reality into negative interest rates. In fact, an astonishing $10 trillion worth of sovereign bonds now trade with a negative yield.
The evidence of these failed policies is apparent. However one must consider the basic facts and peer beyond the narrative being fed to the public by the central bankers, Wall Street, and politicians. There is nothing normal about any of this. It therefore goes without saying, but we will say it anyway – investment strategies based on historic norms should be carefully reconsidered.
Thanks for reading.
Twitter: @michaellebowitz
Any opinions expressed herein are solely those of the author, and do not in any way represent the views or opinions of any other person or entity.

: Worrisome to Broader Market?")
