 The reason I enjoy price PATTERNS so much is that they are, literally, lines in the sand where you can make adjustments, enter positions or carve your own path down the yellow brick road of the entire financial circle of life – fixed income, currencies, commodities, equities (global). I recently explored the case of the potential strength in IBM stock for 2015. It’s been quite the laggard for a while but after the PATTERN completed some bullish signs started to appear. And, at the same time, some charts are hinting that Apple (AAPL – Quote) may underperform in 2015.
So, what to do? And why would we care if Apple underperforms IBM over the coming weeks/months? Here are the cliff notes:
- A “long term” PATTERN has completed which suggests AAPL will weaken against IBM.
- This gives credence to an investable bottom in IBM.
- A “long term” count of AAPL shows a wave 3 complete or with one more possible thrust higher.
- IT ALL DEPENDS ON MAJOR SUPPORT AT/AROUND $100.
- IF we lose $100 to the downside THEN APPL should target the previous wave 4 around $55. Ultimately, this correction is BULLISH.
- Watch the long term LOG trend line for support to bolster the continued move in AAPL.
- IT ALL DEPENDS ON MAJOR SUPPORT AT/AROUND $100.
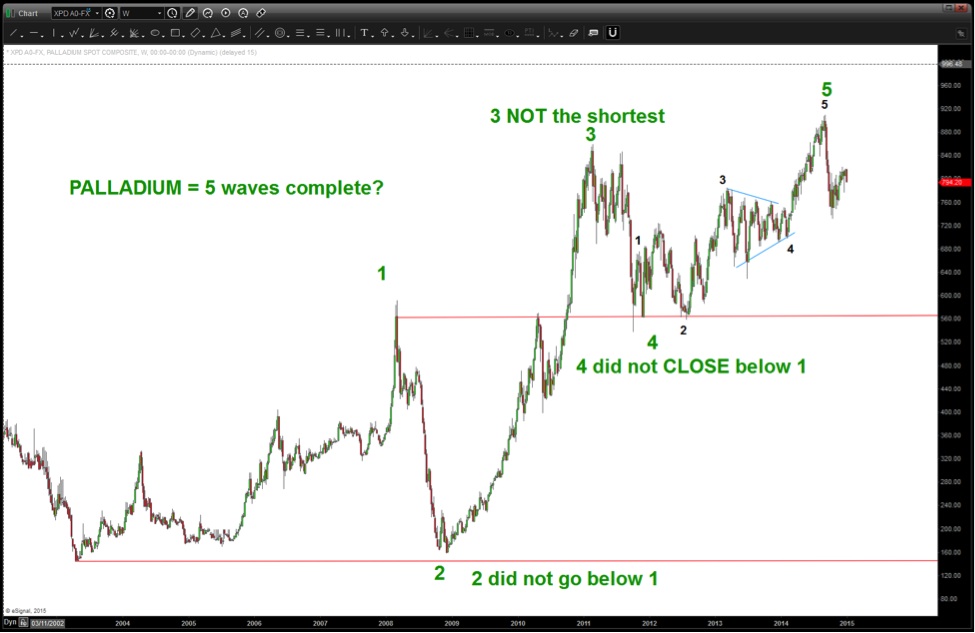
- As a correlation, Palladium appears to have finished 5 waves. If correct, this will put pressure on AAPL.
So let’s provide a bit more color and commentary on what this all means. Could Apple underperform in 2015?
IF IBM is carving out an investable bottom THEN, from a relative strength perspective, the institutions are, more than likely, moving capital ‘out of’ one security and ‘into’ IBM. What’s the biggest and most well known stock out there that almost EVERYONE owns. (OK, maybe dramatic but you get the picture… APPLE)
What is AAPL doing with regards to it’s “relative strength” against IBM? It’s completing a major pattern and the most simple to see – the classic AB=CD pattern. (labeling is not Elliott Wave – just a simple label construct). Click chart to enlarge.
AAPL:IBM Ratio Chart – Is Apple peaking vs IBM?
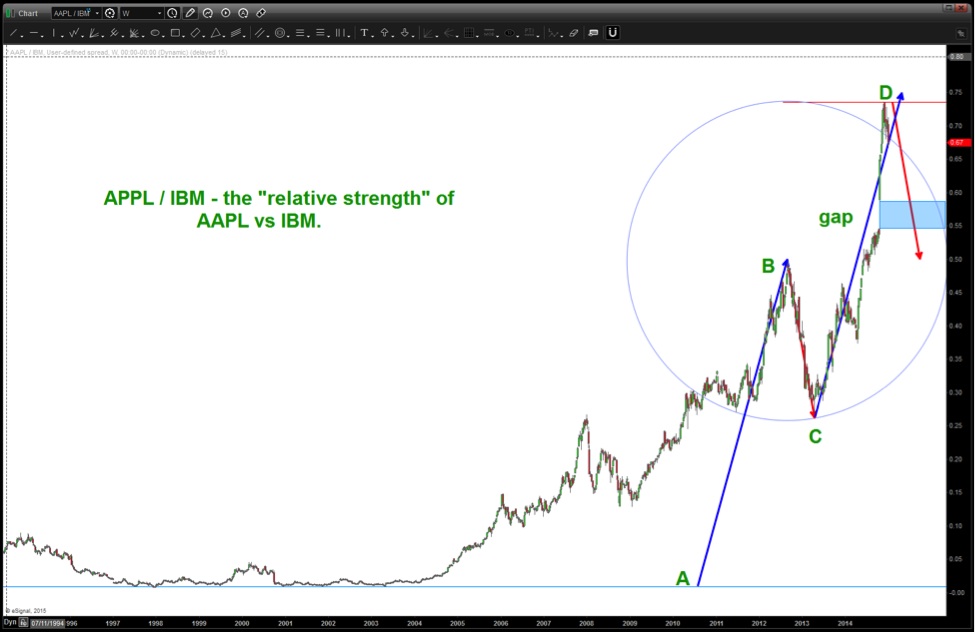
Due to the long-term nature of this pattern – we used the all-time-low from 1997 to project this target one would expect, at a minimum for the gap to be targeted. (blue shaded rectangle) Additionally, the last “major” correction is labeled by the red arrow. Those two areas appear to be the most likely suspects for a pullback in this relative strength ratio of AAPL to IBM.
What does that say about AAPL? Apple underperformance a possibility?
Apple (AAPL) Long-Term Stock Chart – Rising Wedge?
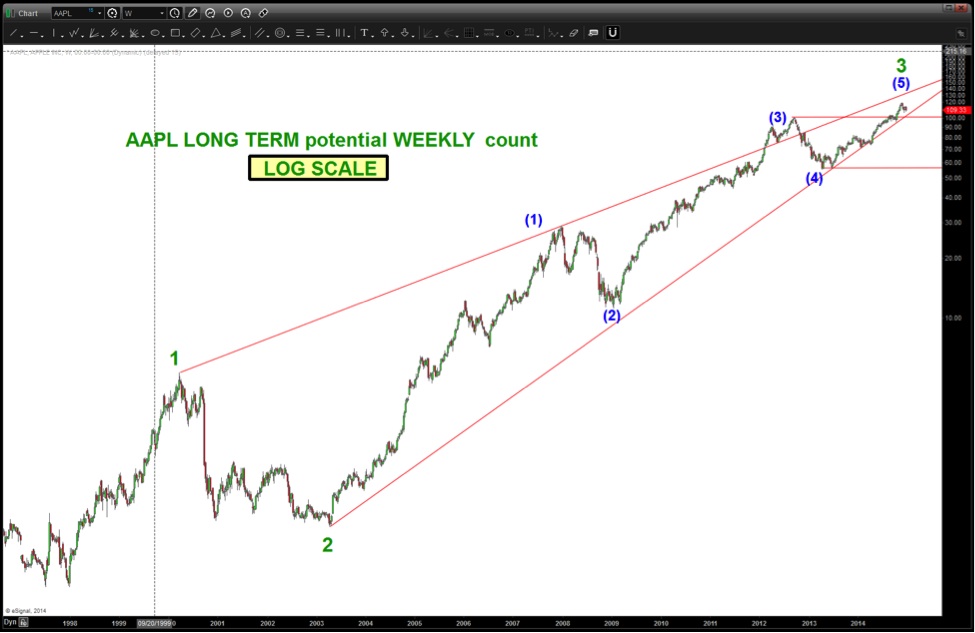
Above you see a potential count using the long term log scale to get a feel for the rhythm of AAPL. The case can be made that we have finished a major, extended wave 3 and a multi-month pullback is inbound for AAPL. Note, the lower trend line from 2003 and how it has captured price on every pullback. Also, note the two horizontal red lines at (3) and (4). Keep those levels in mind as we move down to a daily chart.
Apple (AAPL) Daily Stock Chart – Elliott Wave
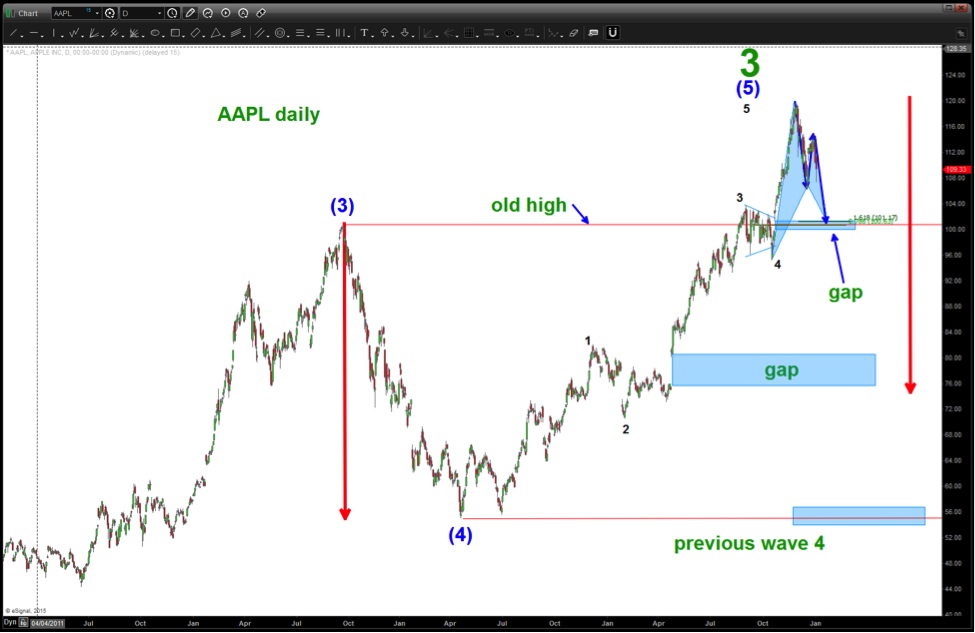
There is a lot going on here but understanding where we are with AAPL is key.
- At 100 we have an extremely powerful BUY pattern on AAPL “daily.”
- We have completed a classic BUY pattern.
- We have the former “all time high” area now acting as support.
- We have an “open window” – gap.
- We are on top of major past congestion (triangle) and therefore in the region of a “previous wave 4”
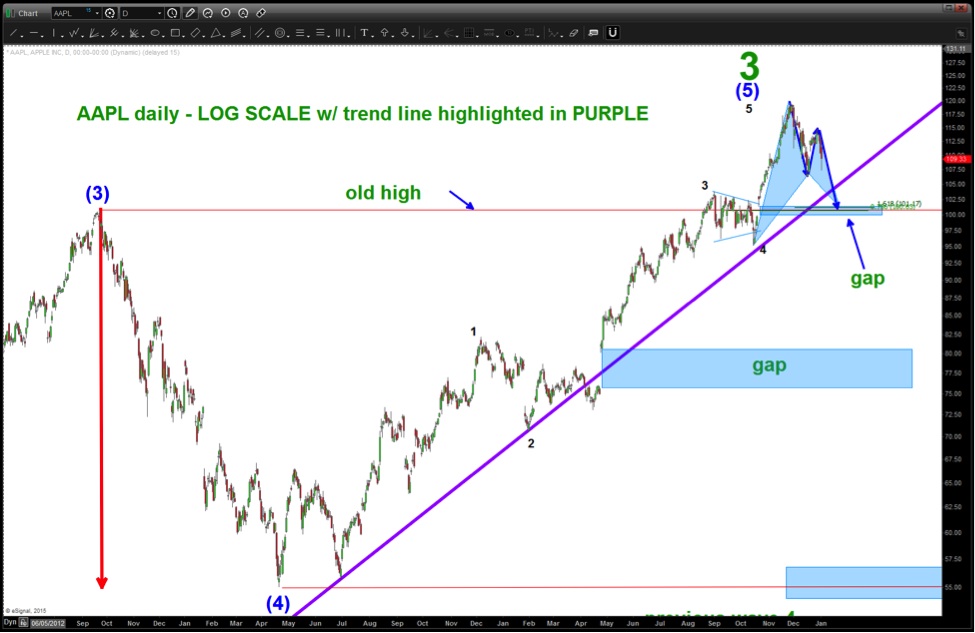
- Remember to watch, closely, the long term log trend line coming up from the 1993 low. Here’s the chart with the trend line in BOLD PURPLE. (changed the colors for the heck of it)
AAPL Long-Term Trend Line
One last thought: Earlier this year, I showed the correlation of Apple’s stock price and Palladium and here’s the chart revisited below. Note, IF the count is correct showing 5 waves complete then Palladium “should” target 560 and that type of downward pressure will affect the price of AAPL. Another potential reason for Apple underperformance in 2015.
Let me know if you have any questions. Thanks for reading and onward into 2015!
Follow Bart on Twitter: @BartsCharts
No position in any of the mentioned securities at the time of publication. Any opinions expressed herein are solely those of the author, and do not in any way represent the views or opinions of any other person or entity.


")


")