With Crude Oil (WTI) Drilling Lower Almost Everyday, The Market Finally Hit Oil And A Geiser Erupted…
I have been looking for a potential bottom in crude oil for a couple weeks now, and it appears we finally have a meaningful low. Prices erupted Thursday and Friday to finish the week up 12.5% and soared 20% from the intraday low of the week down at $37.75/barrel.
This was the best week for WTI crude oil since the financial crises lows in 2008 and 2009. The lows in 2009 were down at $33.55/barrel so the market got pretty close to a full retracement of the gains it saw from 2009 to the peak in 2011.
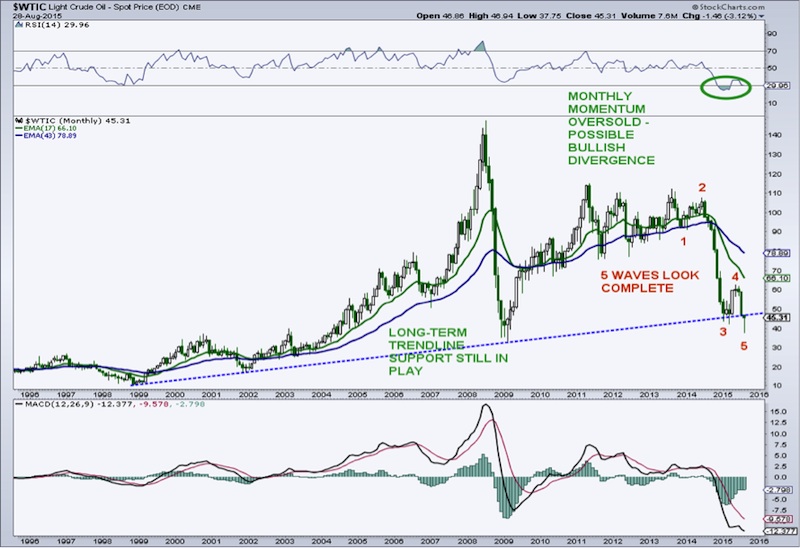
On the monthly chart, there are potentially a number of bullish factors for black gold. Long-term trendline support, going all the way back to 1999 is doing its best to hold the market from a further collapse. It appears that there is a completed 5-wave structure in place. Monthly momentum has cycled into overbought territory, something pretty rare, and is working on a potential bullish divergence, even more rare.
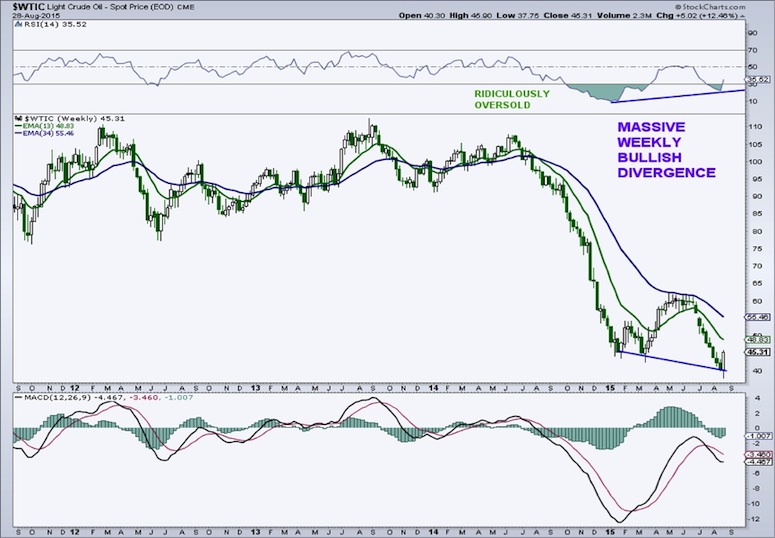
On the weekly chart, there is a striking bullish momentum divergence on the 14-week RSI. There is also one developing on the weekly MACD chart.
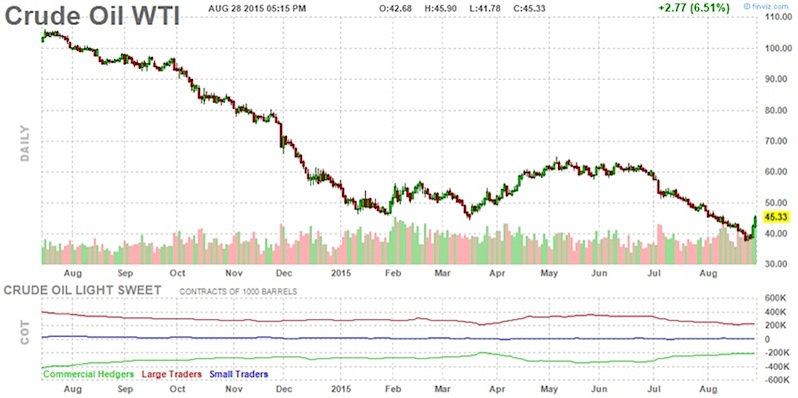
What really got us excited in recent weeks for a bottom in crude oil was the Commitment of Trader’s (COT) Report. Frequent readers of mine know I weigh this data very heavily in my crude oil analysis. In the latest report, commercial hedgers or “smart money” have raised their net futures positions in crude to almost the level seen during March, which happened to be the last time crude bottomed. Large speculators or “dumb money” have reduced their net futures positions in crude to their lowest level, you guessed it, since March.
I get a much higher level of confidence in my forecasts when both the technicals and the COT data line up together. I think the potential for this intermediate-term rally is up in the $50/$60/barrel range and this is still all part of a bottoming process that goes back to the beginning of the year.
In the very near term, I would not chase here, but wait for a pullback and a better entry point, possibly in the low ‘40’s region (with a disciplined stop).
If you are interested in my premium newsletter, please contact me at arbetermark@gmail.com. Thanks for reading and good luck in the week ahead.
Twitter: @MarkArbeter
The author does not have a position in any mentioned securities at the time of publication. Any opinions expressed herein are solely those of the author, and do not in any way represent the views or opinions of any other person or entity.
: Showing Some Signs of Emerging Strength")


: Showing Some Signs of Emerging Strength")