 By Andrew Nyquist After peaking in January, Amazon (AMZN) has spent the better part of the past few months rangebound ($250 – $275). But that may all come to an end after an earnings report that has pushed the stock down over 7% this morning. Concerns are no doubt seeping in as the price is nearing some important AMZN technical support levels.
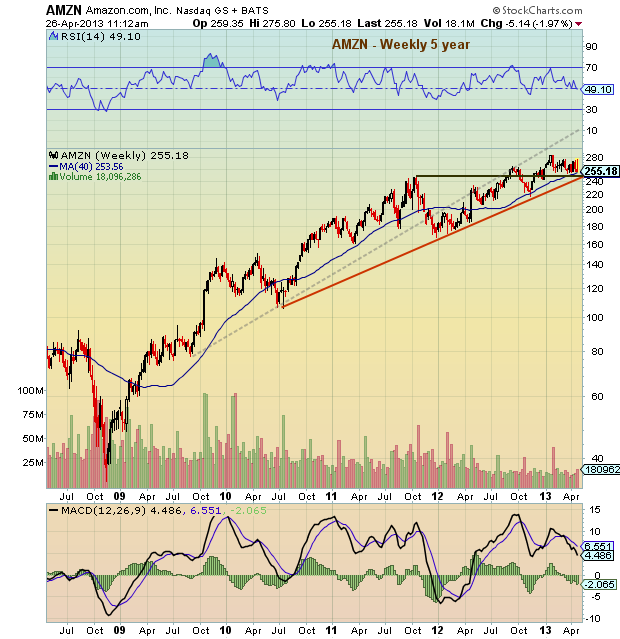
Below are two charts for AMZN stock that play off each other and highlight AMZN technical support. The first is a 5 year macro view and the second zooms in on near-term AMZN technical support. Looking at the longer-term chart, two technical supports come to the fore: 1) $253 (the 40 week moving average) and 2) $240-$245, which is the 2011 highs and late 2012 pivot, as well as the higher lows uptrend from 2010.
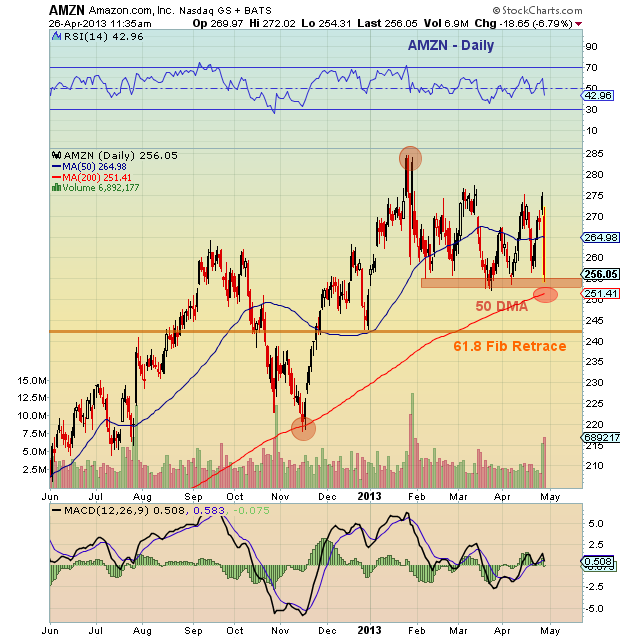
However, taken by itself, that analysis is suspect. That said, looking at a near-term chart for Amazon I am able to zoom in on the recent price action to identify (or confirm) key AMZN technical support levels. And in this case, it appears to be confirmation. In the “zoom” chart below, similar levels are highlighted: 1) $250-$255 is the lower end of the recent range as well as the 50 day moving average ($251). And 2) $243 is the late December 2012 pivot and 61.8 Fibonacci retracement.
Taken together, and simplified, two key technical levels emerge that I believe are worth watching: $250 and $240. Keep an eye on these levels and remain alert. Trade safe, trade disciplined.
AMZN Technical Support – 5 Year Chart
 AMZN Technical Support “ZOOM” Chart – Near Term
Twitter: @andrewnyquist and @seeitmarket
No position in any of the mentioned securities at the time of publication.
: Worrisome to Broader Market?")

: Important Breakout Retest")