Despite topping Q1 EPS estimates and authorizing a $2B share repurchase program, investors in American Airlines stock (AAL) haven’t been impressed by the company’s performance.
Lower fuel prices have been a tailwind for the largest airline in the world, but revenue fell 4% in the first quarter. Consequently, consolidated passenger yield dipped 7.5% to 15.62 cents.
With oil prices back on the rise in recent months, has American Airlines stock priced in the worst case scenario or is there more downside to come?
Let’s take a look at the AAL chart.
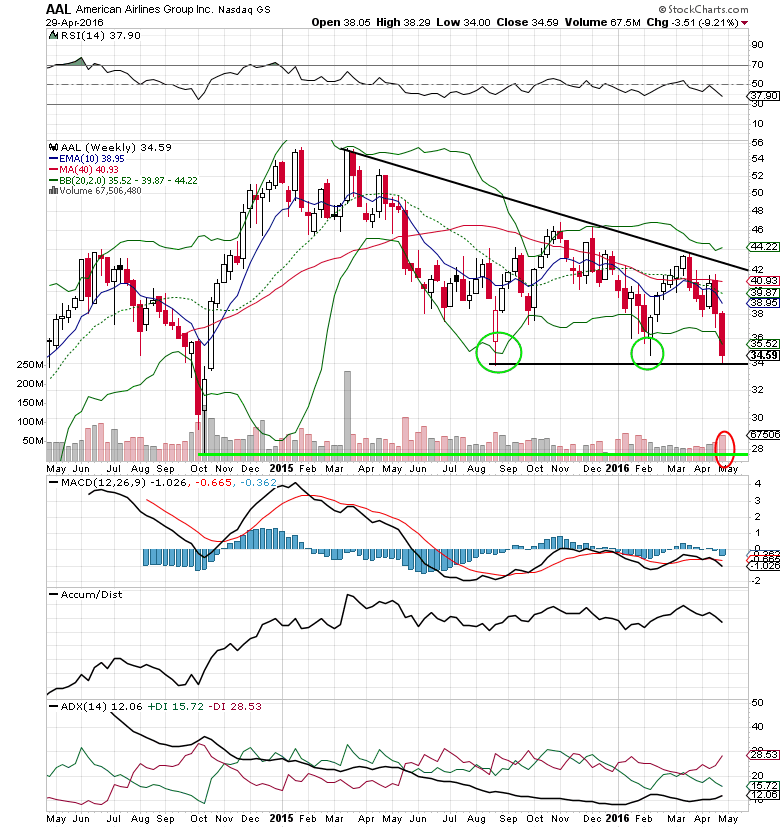
Chart overview:
- AAL shares are trading down 37%+ from the all-time high hit in 2015; 18% year to date
- American Airlines stock has been steadily been trending lower since the “double top” that was put in early last year
- Now AAL is has come down once again for a retest of major support at the $34 level
Keep in mind that the latest fall is occurring on above average volume, so it would be prudent to wait for other buyers to step in first (watch for similar reversals like in August and in February). Realistic upside potential at this point would be to the top of the descending triangle ($40-$42). Otherwise if the stock breaks through $34, it could mean a return to the low $30’s or even the high $20’s later this year.
Thanks for reading.
Twitter: @MitchellKWarren
The author does not hold a position in mentioned securities at the time of publication. Any opinions expressed herein are solely those of the author, and do not in any way represent the views or opinions of any other person or entity.


")


