 By Andrew Nyquist
Since the bottom a couple weeks back, the Technology Sector has surged higher. And it isn’t a surprise that Apple (AAPL) has lead the way, up almost 17 percent from its reversal lows. But that being said, many major indices (and stock leaders) are nearing important areas of resistance that may slow or stall the rally.
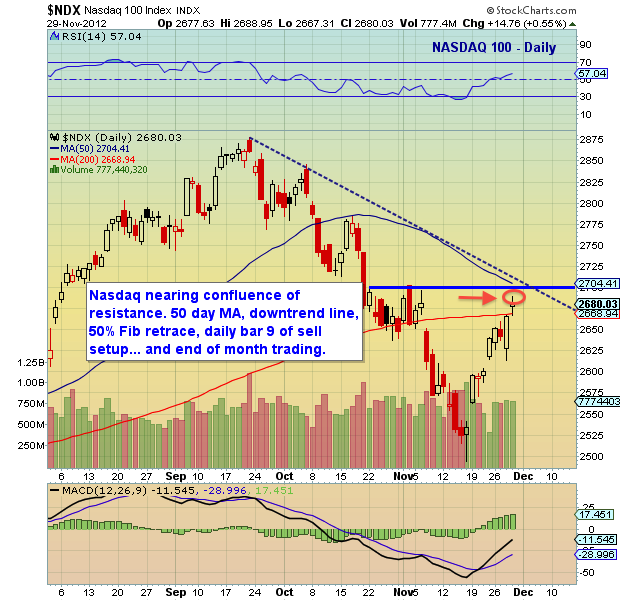
Looking at the Nasdaq 100 (NDX), the index is nearing a confluence of resistance including its 50 day MA, downtrend line, and 50% Fib retrace (2687, hit yesterday)… as well as the closure of month-end “mark ups.” Note that the index is also on bar 9 of a daily sell setup that should bring a pause or pullback soon.
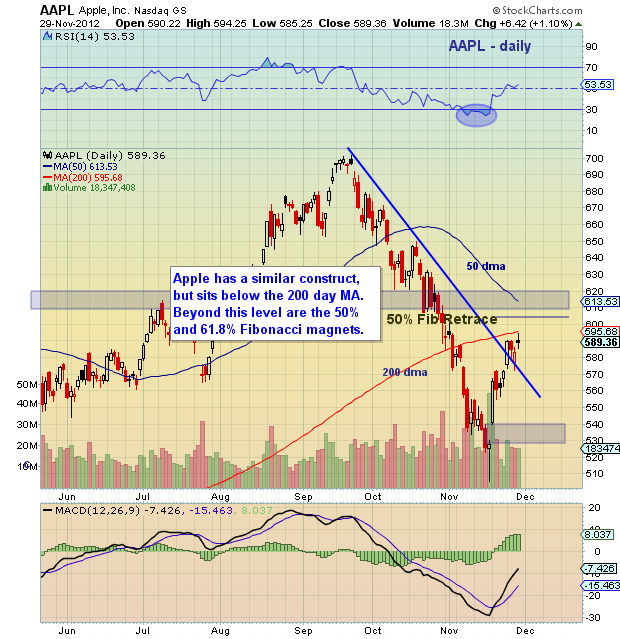
I see a similar setup in Apple’s stock chart, however, the stock does appear to have a bit more wiggle room higher if it wants it. This may indicate one of two scenarios for Technology stocks:
1) Tech will push a bit higher, then stall.
2) Alternatively, Tech will stall here, before pushing higher after recharging its batteries.
See charts below and have a great weekend. Trade safe, trade disciplined.
Nasdaq 100 (NDX) Daily Bar Chart:
Apple (AAPL) Daily Bar Chart:
———————————————————
Twitter: @andrewnyquist and @seeitmarket Facebook: See It Market
No position in any of the securities mentioned at the time of publication.
Any opinions expressed herein are solely those of the author, and do not in any way represent the views or opinions of his employer or any other person or entity.


