 The U.S. financial markets appear to be as groggy as its investors returning from the long weekend. A quick scan of the futures market brings this theme to life with the major U.S equity indexes down slightly and key commodities following suit in listless action.
But with the major indexes at all-time highs, it doesn’t take much digging to find interesting setups heading into this week. But as I scanned my list of key stocks and ETFs heading into this week, I noticed that a few important names were at critical junctures. And the price action on the 5 charts below may serve as market tells this week.
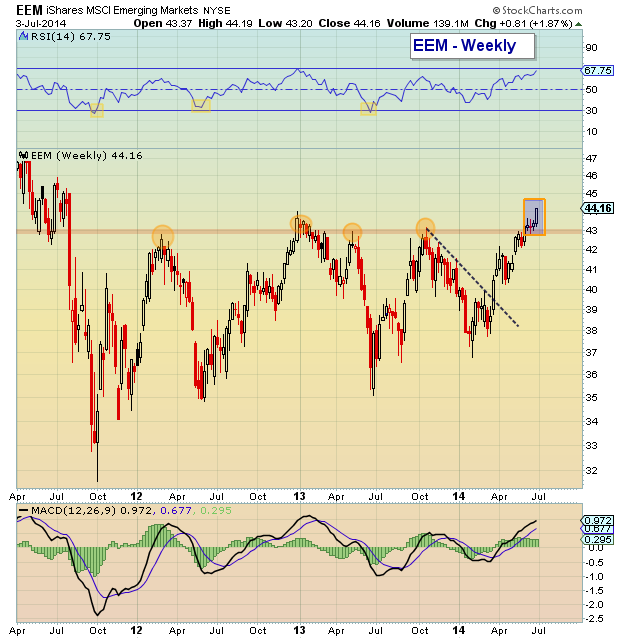
Emerging Markets – EEM Chart
Emerging Markets (EEM) have spent the better part of the past 2 years in the dog house (relative to developed markets). Rally attempts stalled near $43/$44, helping to develop strong lateral price resistance with each failed rally. But EEM may be showing more promise here. Last week put in a long white candle, appearing to breakout of its 2 year jam. This week, investors will look for follow through (to confirm the breakout). A valid breakout in Emerging Markets would indicate greater participation in the global equities rally.
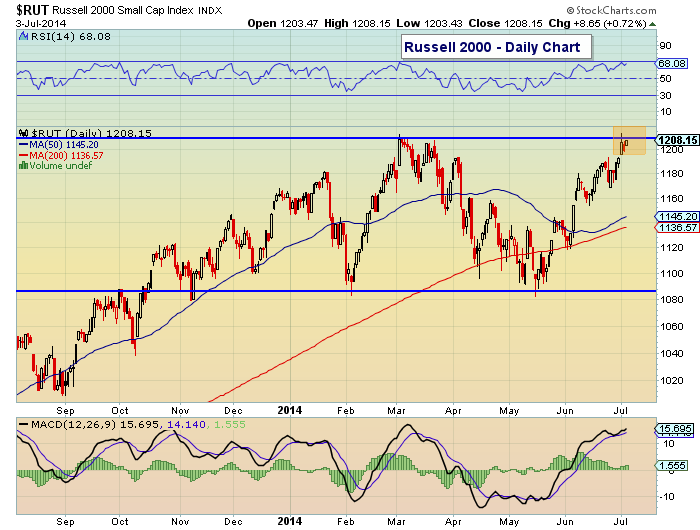
Russell 2000 (RUT) Chart
The small caps have always been a great indicator of investor risk tolerance in the markets. And although the RUT experienced a big sell off earlier this year, it has been battling back and may be on the verge of a breakout. BUT, as many technical investors understand, the first retest of prior highs often finds resistance. And this could slow equities down for a few days.
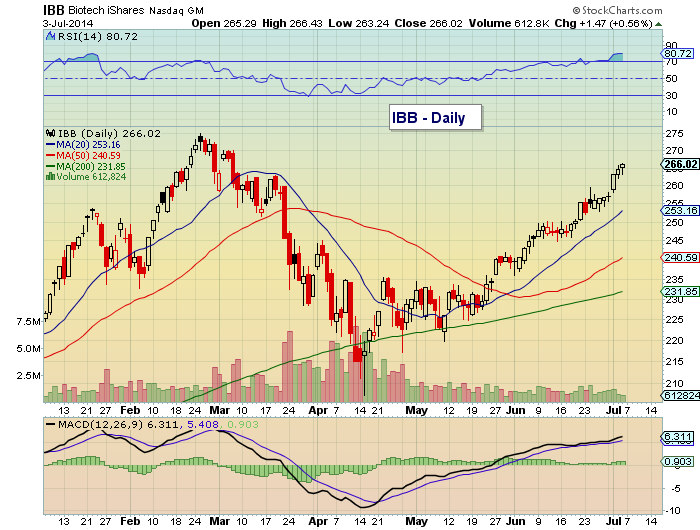
Biotech ishares (IBB) Chart
A similar theme is developing. Several key ETFs and index funds are returning to prior highs (i.e. retesting). Biotech is red-hot once again… perhaps too hot. The 81 reading on the RSI is highlighting a need for consolidation or pullback. As a prior darling sector in the market place, it will be interesting to see how this sector behaves over the coming week(s).
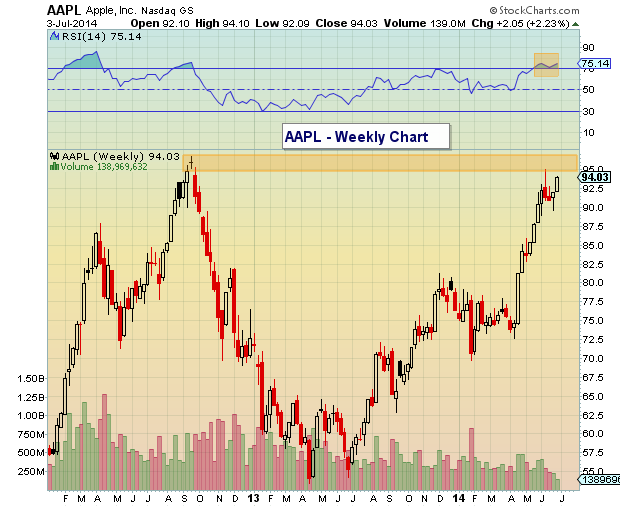
Apple (AAPL) Chart
As previously noted, Apple has climbed all the way back to retest all-time highs. It has spent the past several days consolidating gains and working off overbought levels through time (over price). This could setup the cash-heavy behemoth for a run to new all-time highs. But, as mentioned above, waiting for confirmation to add to (or initiate) a position is the safest bet.
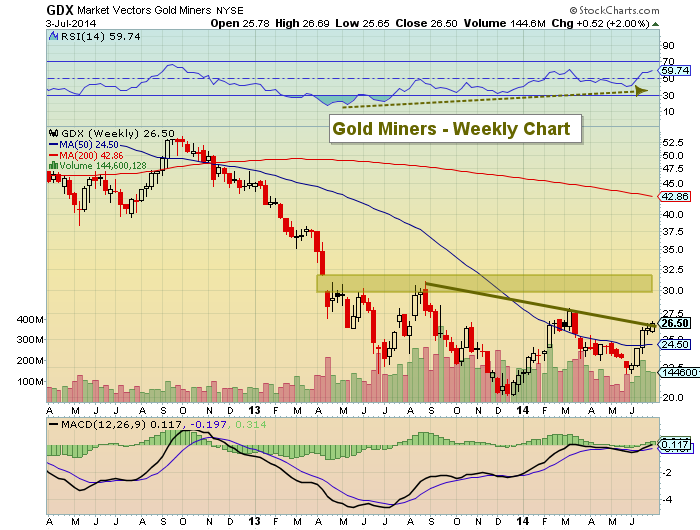
Gold Miners (GDX) Chart
The miners have been on our radar for a while. And this means that time is going to wear thin if the miners can’t break out above downtrend resistance in the coming days. GDX closed strong last week, so perhaps this week will be the week. But, as with EEM, confirmation is key.
As you can see, there’s plenty of things to watch in the week ahead. Thanks for reading.
No position in any of the mentioned securities at the time of publication. Any opinions expressed herein are solely those of the author, and do not in any way represent the views or opinions of any other person or entity.


