Gold mining stocks are officially on the trader radar. Including today’s surge higher, the Gold Miners (GDX) are 25 percent off the 52 week lows recorded in December. And, although the group is getting overbought short-term, it may be setting up nicely for a “buy on consolidation” swing trade.
With this in mind, let’s look at the technical setup.
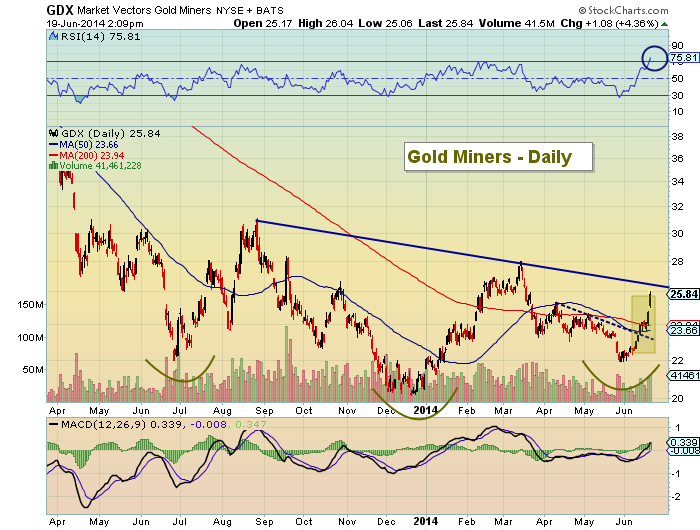
On the daily chart, the Gold Miners put in a higher low (21.93) in late May. Holding this low will be critical to any durable rally for the Gold Miners. As well, the ETF broke above its multi-week downtrend last week, which set up the recent surge. This has also lifted the Junior Gold Miners (GDXJ). Fellow SIM contributor Sheldon McIntyre was early to that party, highlighting the setup in the Junior Gold Miners last week:
$GDXJ with a statement week. Any consolidation should be bought. 200-week sma at 87.74.
— Sheldon McIntyre (@hertcapital) Jun. 12 at 03:31 PM
Returning back to GDX, the first obstacle would be getting through multi-month downtrend resistance around 26.25/.50. And this may not be easy on the first attempt. The daily RSI is nearing 76, so some backing and filling may be in order over the near-term. The next resistance level resides at the March highs (28.03). Putting in a higher high would be constructive from a macro perspective and firm up the 1 year base that been building. It is also worth noting the technical inverse head and shoulder pattern that is forming.
Gold Miners GDX Daily Stock Chart
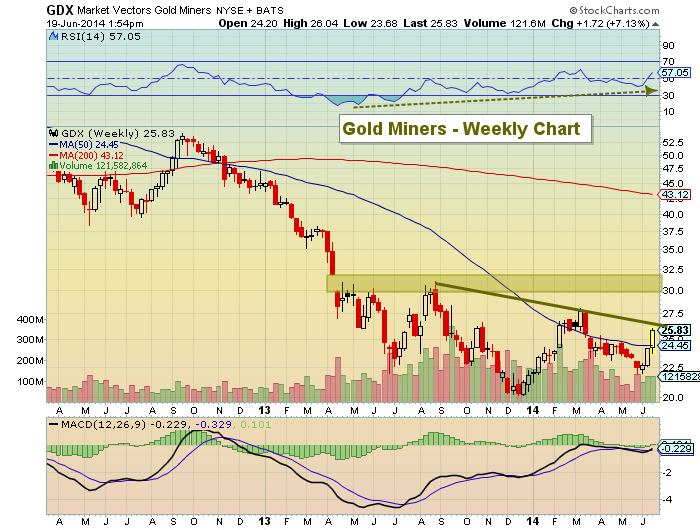
On the weekly chart, the RSI is constructive. It’s registering in at just 57 and showing a series of higher lows. If price can climb above 28.03, GDX could see a fast move into the open gap (30-32). And, in regards to the aforementioned inverse head and shoulders pattern, a triggering could carry GDX into the mid 30’s. This is a wider angle view, so any moves to the upside will need to develop over the coming weeks. And managing risk will be key for traders, as fast moves can also come from failed breakouts/patterns.
Gold Miners GDX Weekly Stock Chart
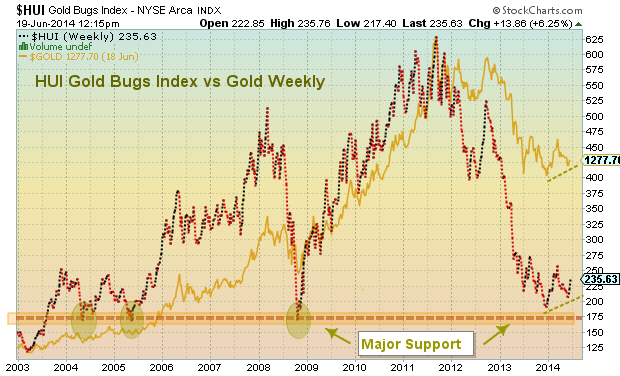
The final chart is that of the Gold Bugs Index (HUI). The index bounced off lower support and has put in a higher low with the spot price of Gold. This makes the recent price lows on GDX that much more important to hold near-term.
Gold Bugs Index (HUI)
Sentiment will need to be monitored on this rally as well. Previous rally attempts have brought the bulls out full-boar, only to see their hopes crushed. A little skepticism would be healthy and serve as a contrarian catalyst to keep this rally going.
No position in any of the mentioned securities at the time of publication. Any opinions expressed herein are solely those of the author, and do not in any way represent the views or opinions of any other person or entity.


