Potential price resistance is among several obstacles posing a challenge to the 2016 natural gas rally.
As equity managers, we mostly talk about the equity market. And for the past 8 months, much of that talk has centered around the post-February stock market rally. However, stocks aren’t the only thing that have bounced sharply since early in the year.
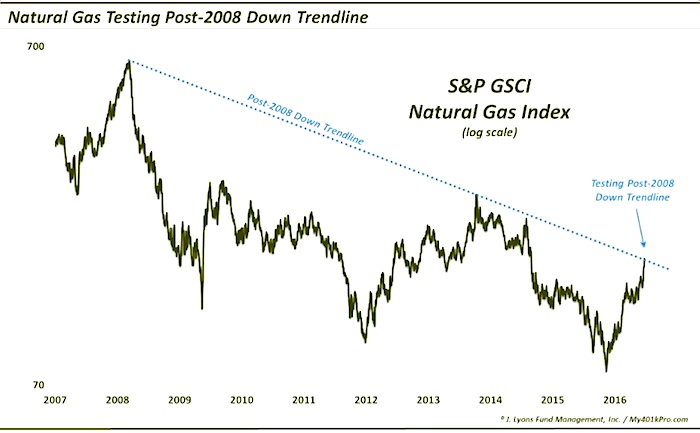
Many commodities have also rallied, including natural gas. In fact, the 2016 natural gas rally has seen prices more than double since bottoming at the beginning of March (we do not trade futures so that performance is measured by the S&P GSCI Natural Gas Index which closely tracks the commodity – unlike the ETF’s [e.g., UNG – NYSEARCA:UNG] that have obvious tracking issues).
That said, there are a few factors that may present a challenge currently to the 2016 natural gas rally. Not the least of which is price. Specifically, the GSCI Nat Gas Index is bumping up against the Down trendline stemming from its 2008 top and connecting the early and late 2014 tops.
2016 Natural Gas Rally… coming to an end soon?
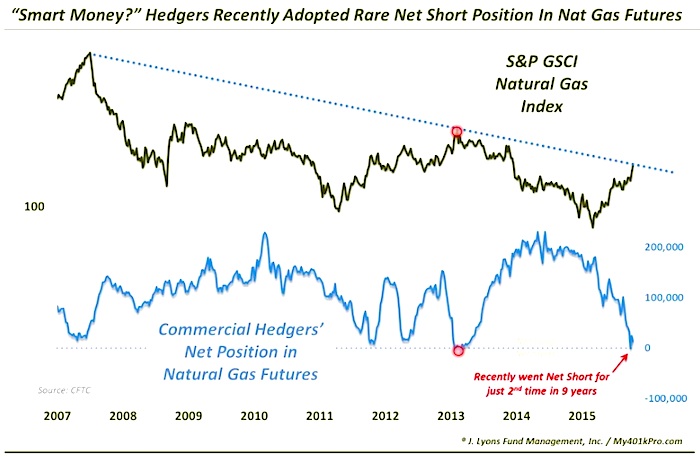
This trendline may present a hurdle for the current extension of the natural gas rally. That is not the only challenge potentially facing natural gas prices, however. One other red flag comes in the form of positioning in the natural gas futures market. Specifically, according to the CFTC, Commercial Hedgers recently adopted a net short position for just the 2nd time in the past 9 years. The concern is that these Hedgers most often represent the “smart money” once positioning gets to an extreme. Thus, this rare net short position indicates a potential headwind for nat gas prices, at least based on historical behavior.
Early 2014 was the only other time Hedgers went net short in the last 9 years. Natural gas prices peaked immediately and commenced their 2-year ~70% decline. Additionally, other times since 2007 that saw the Hedgers approach a net short position coincided with at least short-term tops, including October 2012, April 2013 and the major, long-term top in 2008.
At least one other red flag for the 2016 natural gas rally comes in the way of seasonality. Now, seasonality represents overall historical tendencies and, thus, should not be taken as gospel. However, according to www.sentimentrader.com, on average, by far the best 2 months of the year for natural gas prices are September and October. After that, they tend to peak and the subsequent 4 months have negative average returns, historically.
The rally in natural gas prices this year has been impressive, including a 20% pop to 2-year highs in just the past 2 weeks. Thus, the bulls are firmly in control. However, at least a trio of obstacles in the form of long-term trendline resistance, futures positioning and seasonality could potentially conspire to extinguish this current leg of this natural gas rally.
Thanks for reading.
Twitter: @JLyonsFundMgmt
Read more from Dana’s Tumblr Blog
Author may have positions in mentioned securities at the time of publication. Any opinions expressed herein are solely those of the author, and do not in any way represent the views or opinions of any other person or entity.


