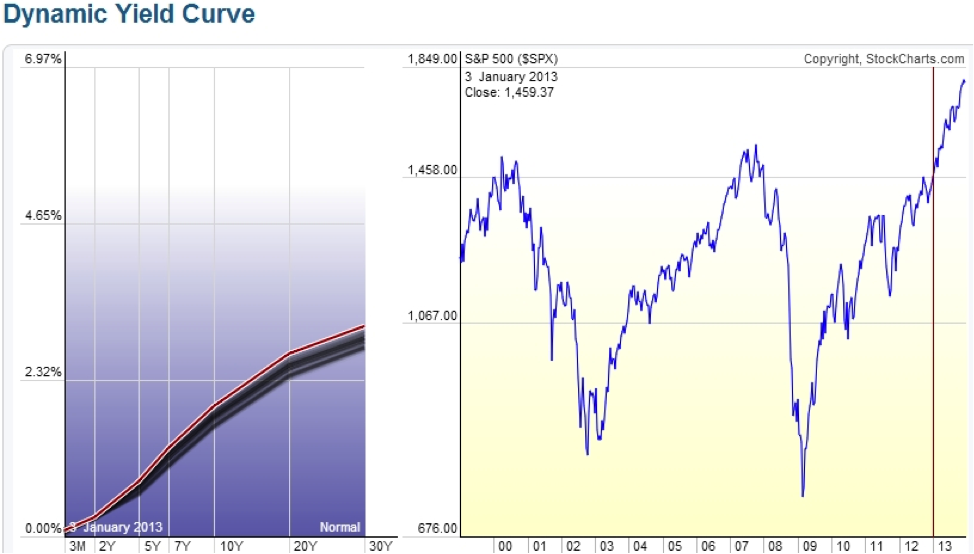
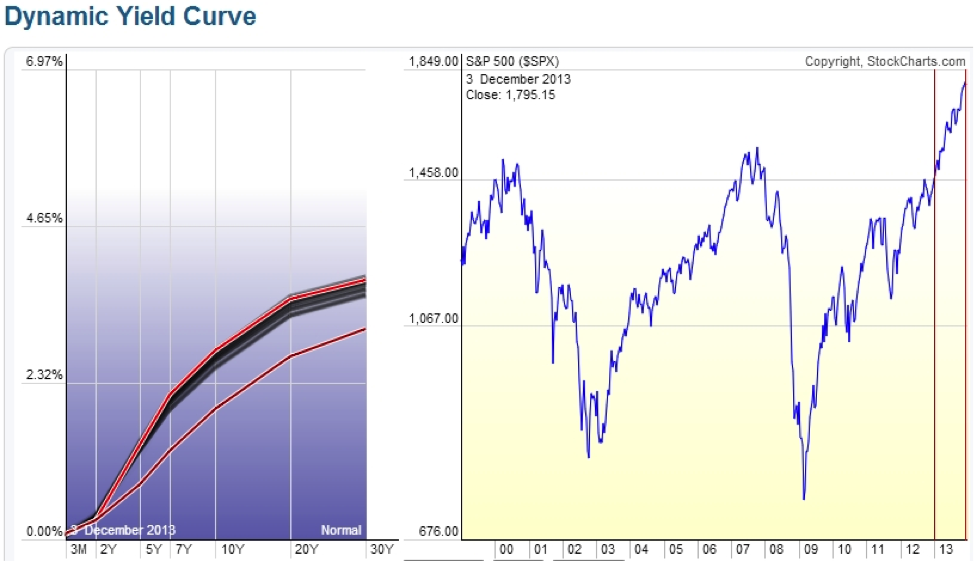
I wrote to you all last year in February about my forecast that market participants would see some dramatic yield curve steepening this year:
And it is my opinion that this will drive the price of 10-year & 30-year bonds down faster than the 2 & 5-year bonds. To take advantage of this speculation, one such strategy that I look at is a yield curve steepener spread. – Feb 2013
In the graphs below, it is clear that we got exactly that.
Yield Curve Jan 2013
Yield Curve Dec 2013
So what will the yield curve have in store for us in 2014?!
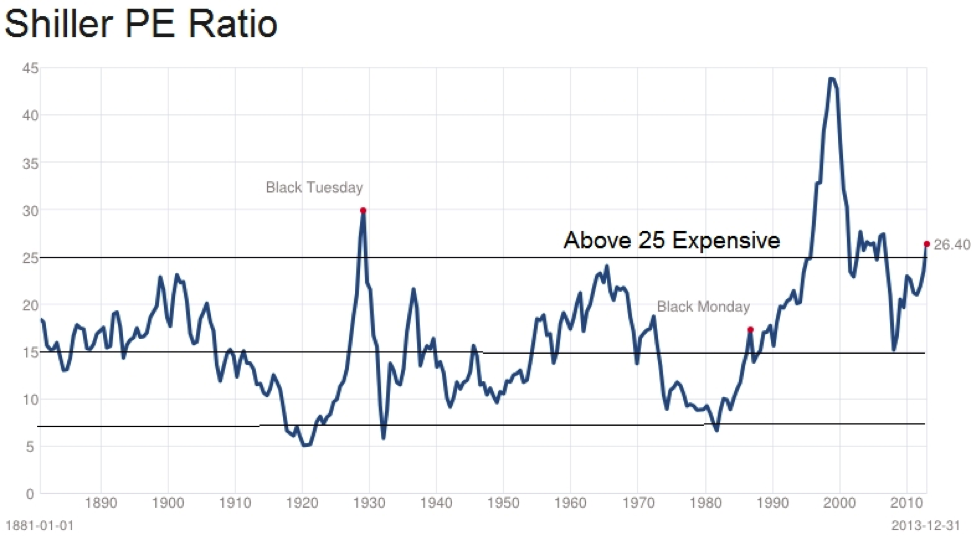
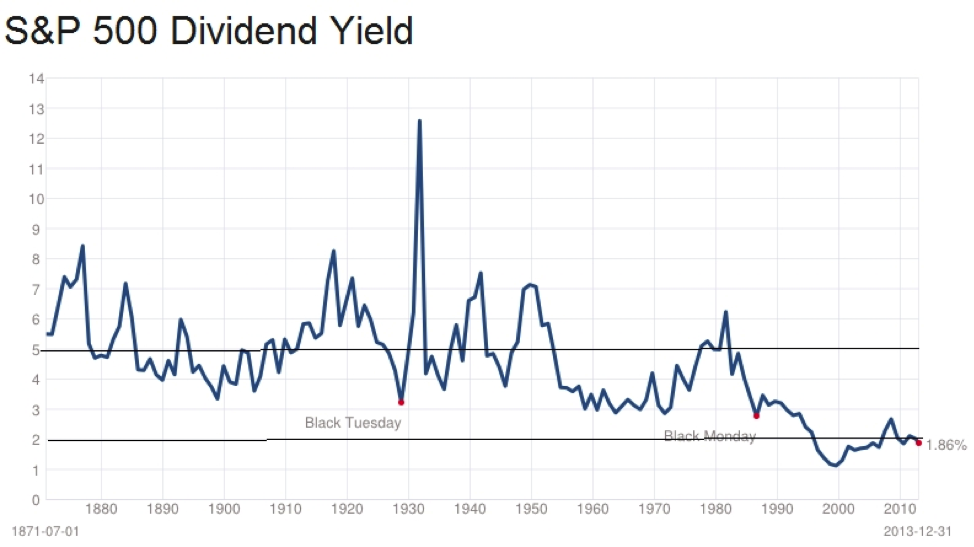
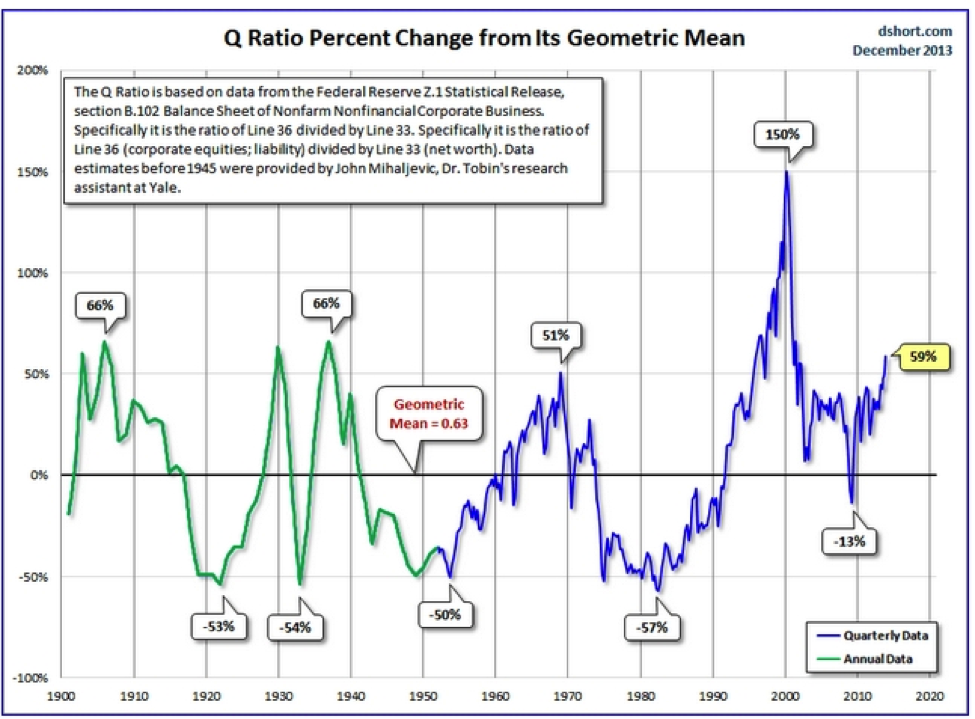
Well, the FED’s new word magic TAPERING has fast replaced discussion of “QE” infinity and this seems to have coincided with (and possibly ignited) my expected big slide in bond prices for 2013. This has also assisted in pushing 5 year real interest rates back into the black! (positive .06% currently) and 10 year real rates from -.75% on Jan 2013 to .80% currently. It is of my opinion that we have started a generational super bear market in Bonds. But, as you all know, there are cyclical bull moves within larger Bear markets. And this is exactly what I expect for 2014. With stocks at all-time nominal highs and pushing levels of over valuation (in terms of Shiller P/E, Dividend yield, and Tobin Q ratio – see charts below), I would expect capital to slowly rotate back into interest rates slightly and possibly increase if we see a sharp move down in stocks.
What will this mean for the Yield Curve?
Stabilization and possible flattening – I think 2014 will be a year of transition. And if inflation starts to rise, the short end will begin to free fall (possibly near the end of the year). It is very difficult to forecast yield curve inversions but when they do happen they have a very high probability of signaling a recession and possible bear market in stocks. Also I think the TED spread (treasuries vs Eurodollars) will be the signaling spread. Since the FED as cemented the treasury short end to the floor the Eurodollar market will lead the charge. Keep an eye on the TED because if a rapid widening does happen it could have large ripple effects across the curve.
Reference Graphs Relating to Stock Market Valuation – sourced from Multpl.com and dshort.com
No positions in any of the mentioned securities at the time of publication. Any opinions expressed herein are solely those of the author, and do not in any way represent the views or opinions of any other person or entity.


