By Alex Bernal In this article I want to circle back to one of my previous posts on analyzing yield curves and offer up a few insights into spread trading strategies and reading spread charts. I will also highlight my approach to trading spread curve steepening. In my initial blog on yield curves, I highlighted how the U. S. Federal Reserve has married itself to ZIRP (zero interest rate policy) until death do them part by anchoring short-term interest rates at zero. And this has lowered the probability of seeing nominal yield curve inversion to a range of slim to none… and slim just left the building. So what does this have to do with spread trading? Well, let’s do a quick yield curve update before offering some spread trading education.
“Don’t Fight the FED” Yield Curve Update
The Fed recently said it would probably keep interest rates at virtually zero into 2015. By leaving their purchases “open-ended” and extending guidance, the Fed seems to be risking a steeper yield curve. This steepening would signal more inflation risk and also reflect a negative outlook on the prospect for a “recovery.” It is my opinion that when the FED eventually loses control of the curve the long end will be the first to slip through its fingers.
I fully believe that the Federal Reserve will continue to flood the system with QE to infinity in its feeble attempt to get the stimulus depended economy back on the dance floor.
In the meantime, it is a wonder to me that we don’t see much use of the word STAGFLATION in the media, even though it’s pretty clear to me that the “JOBS” are not coming back (Stag-). Charles Hugh Smith explains why here in a good read.
…And Inflation is clearly starting to wreak havoc on the cost of living (-Flation)
Since the only two certainties in life are Death & Taxes, eventually the weakening of the US currency in real terms will cause the Japanese and Chinese central banks to stop purchasing US Treasuries. And it is my opinion that this will drive the price of 10-year & 30-year bonds down faster than the 2 & 5-year bonds. To take advantage of this speculation, one such strategy that I look at is a yield curve steepener spread. Before I discuss this type of trade in any detail, I want to offer a little crash course in spread trading….
Spread Trading Basics
Some of my closest cohorts have managed very large portfolios that are entirely built on differing spread trading strategies, so I thought a little spread trading primer would be interesting for everybody.
The featured yield curve spread is between two like interest rate contracts under different months; this is often referred to as an intra-commodity spread. As well, there are endless types of inter-commodity spreads that I track and analyze. These are spreads between two or more different commodities.
Some of the spreads I follow include:
- Brent vs. Crude
- Crack Spread The Widow Maker
- Crush Spread
- Russell, DJIA, SPX matrix (i.e. index arbitrage).
- Gold, Silver, Platinum
- Eurodollar Calendars & Butterflies
- CBOE VIX term structure “calendar spreads”
Some Advantages of Spread Trading:
- Often allows traders to assume less risk than an outright position
- Margin requirements are often substantially lower
- Correlation and Mean reversion strategies often outperform during consolidative market conditions
- Decreases “directionality” risk
Some Disadvantages of Spread Trading:
- Automatic stops are typically not available. And, if they are, they are not cheap
- Twice the commissions
- No guarantees that the spread will “mean revert.” Even highly correlated markets often “blowout” in times of irrational expectations.
Spread Analysis
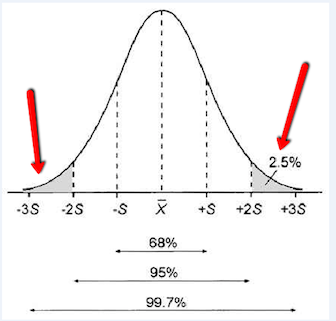
Since directional expectation of the underlying is often not the primary motive in spread analysis, more investigations into correlations, mean reversions & seasonality are often implemented. To take advantage of statistical relationships, I often look for spreads that are currently at extreme readings in terms of their normalized distribution curves (see graph below). And similar to the techniques in any market profile, I look for some form of a reversion to the mean. Unfortunately, the tools to do this analysis are not regularly available other than on Bloomberg terminals or other custom fancy excel spreadsheets.
Trading Interest Rate Spreads
The Spread Trading Setup: The long end of the treasury curve has been showing signs of being under selling pressure for the past couple months. And this has translated to trend reversals in the underlying treasury spread trades. Two of the more common spread trades I follow are the “Tuts” (twos – tens spread) & the “Fyts” (5 vs. ten spread). There are other spreads of different duration, but for trading purposes I have found that trading these two in conjunction is a balanced way of getting “bang for your buck” while “controlling volatility risk.” You can duplicate these spreads in the Eurodollar market (and arbitrage the two as well), but I’ll save that subject for another post.
The Below daily chart is the Twos-Tens adjusted for DVO1 risk.
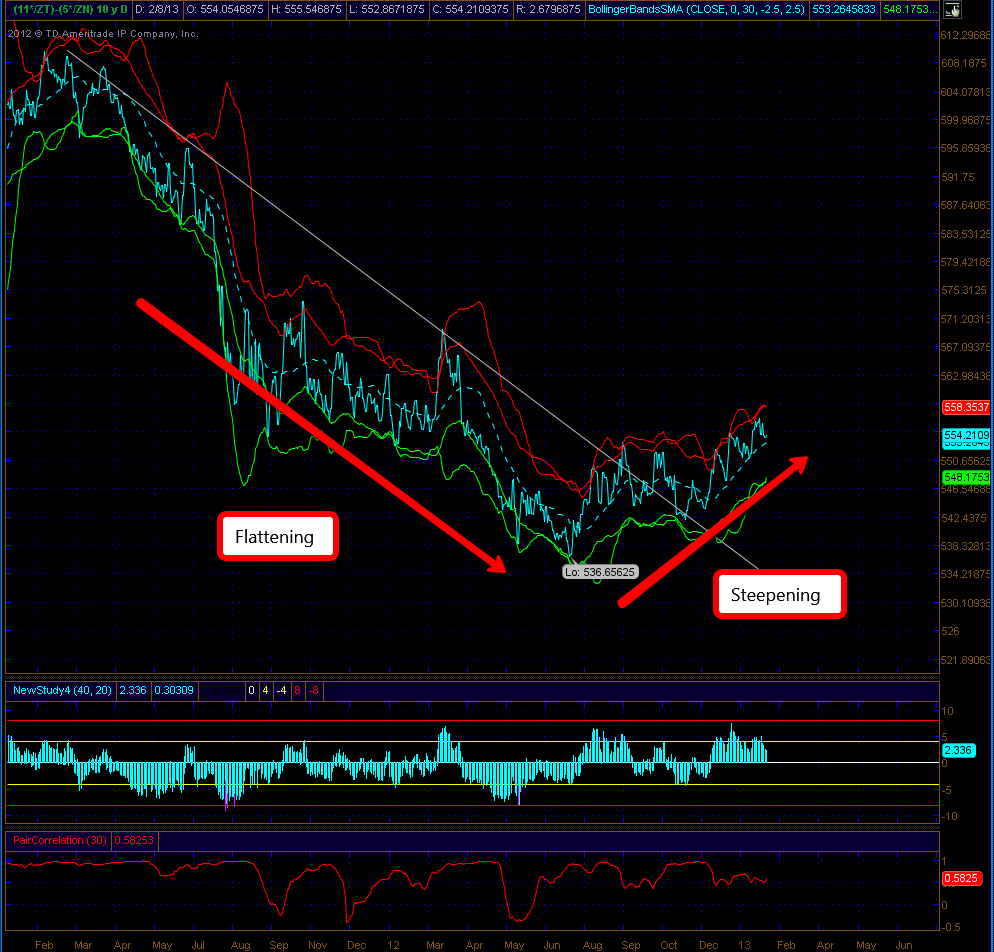
You can clearly see that the TUT has broken primary trend line and is showing minor waves of higher highs and higher lows. To me, this is the primary spread duration that often leads the direction of other shorter duration spreads. So since my expectations are for the TUT to continue higher, I am actively looking to “buy the dip” in the FYT (Long Five year Treasuries – Short Ten Year Treasuries) – betting that the difference, or curve, in the yield between the two will increase. Since there is a directional component of this spread I am actively looking for trades only in the direction of the underlying trend. And similar to any other trade I use a clearly defined stop losses and targets.
Under the hood
Some of the best tools I have found for timing my spread trades are:
- Price Bands: Bollinger, Volatility, Envelopes & Projection.
- Value Charts: Ceveloped by Mark Helweg & David Stendahl
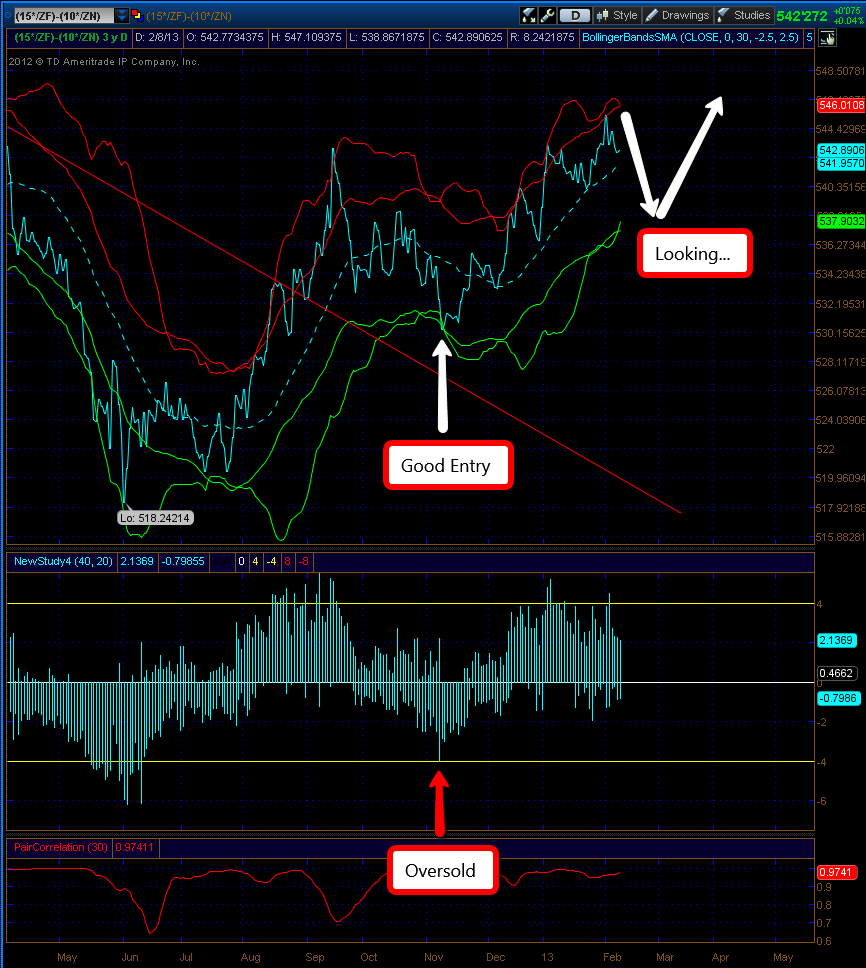
You can see in the example shown below (FYT spread trading chart) that waiting for the spread to eclipse the bands, coupled with an Oversold reading on the value chart provides for a pretty accurate entry point.
What I really like about this particular type of trading is that it offers many flexible options for shifting your trade as the market develops. One example would be if during the undulations of the spread I feel that another treasury future of different duration might offer better probability, I can simply leg out of one side of my current spread and replace it with a different leg (i.e. Roll fyts into tufs = buying back short ten year leg and selling 2 year treasuries).
Hopefully this didn’t fly over too many peoples heads, more to come on the topic in the future & thanks for reading!
Disclaimer: This in no way constitutes investing advice. All of these opinions are my own and I am simply sharing them. I am not trying to convince anybody to do anything with their money. I am simply offering up ideas for the sake of discussion. As always, everybody is expected to do their own due diligence and to ultimately be comfortable with their own investing decisions. Any actions taken based on the views expressed in this blog are solely the responsibility of the user. In no event will Aether Analytics or its owner be liable for any decision made or action taken by you based upon the information and/or opinion provided in this blog.
Twitter: @InterestRateArb and @seeitmarket
No position in any of the mentioned securities at the time of publication.
Any opinions expressed herein are solely those of the author, and do not in any way represent the views or opinions of any other person or entity.


