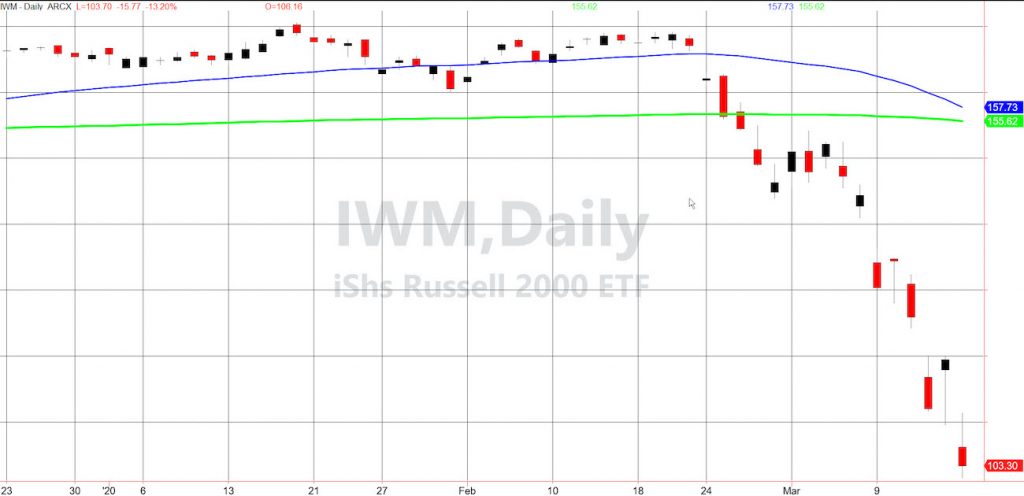
The Russell 2000 (IWM) experienced its worst sell off ever.
I was on the floor of the NY Commodities Exchanges on October 19th, 1987.
At the time, high interest rates were partly to blame for the market crash.
The stock market took a year to recover.
Commodities were better, but like what we saw today, hardly immune to a large liquidity event.
With the government and the central banks pulling out all the stops to try to ameliorate both business and consumer bloodshed, the market could not sustain a rally.
However, some instruments at least, held the morning lows, while others closed above last week’s lows.
The Banks are more focused on businesses, whereas Kudlow said that there will be $400 Billion more available to offset the consumer economic shock of the virus.
Some scientists believe the virus will peak out and then begin to wane in a month.
Others believe it could take 3 months before we see a peak.
Not only is that a huge difference health-wise, it will impact how significant and for how long any stimulus might help both the economy and the public.
So far, the reaction to the stimulus is underwhelming to say the least.
Besides holding mostly cash and a defensive position in equities, here are a few instruments worth watching.
In the area of Biotchnology, certain companies are worth watching like Biogen BIIB, Regeneron REGN and Mylan Labs MYL (not as pretty and afer early gains, closed red.)
In the food stocks, both Kroger KR and Sprouts SFM had good moves with KR in striking distance of new 2020 highs.
Yet, in keeping with my stagflation theory, which only looks more likely given the Fed’s actions and the impact of the virus concerning supply chain, let’s dig into gold and gold miners.
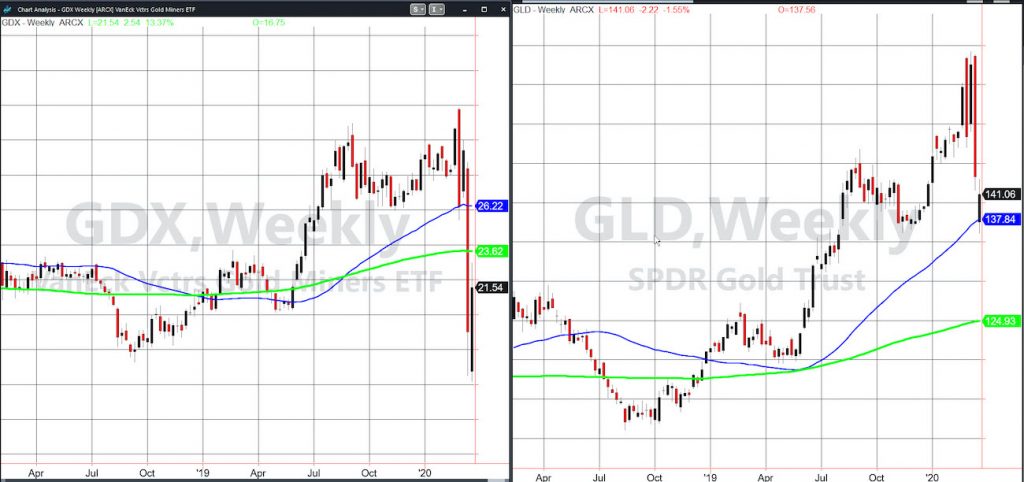
Looking at both weekly charts, GLD needs to hold 137.80 or the blue 50-week moving average.
GDX is not as pretty. But, the 2019 low at 20.14 is a good area to keep in mind for support.
S&P 500 (SPY) the 2018 low is 233.76.
Russell 2000 (IWM) the 2016 low is 93.64
Dow Jones Industrials (DIA) the 2016 low is 154.38 (as crazy as that sounds). Note that 207.69 is the 80-month moving average.
Nasdaq (QQQ) 143.46 is the 2018 low.
KRE (Regional Banks) broke the 2016 low at 32.63 but good number to watch.
SMH (Semiconductors) still in the best shape. 112 is price resistance and support is at 97.60
IYT (Transportation) 114.91 is the 2016 low.
IBB (Biotechnology) 100.51 is the 80-month moving average. 89.01 is the 2018 low.
XRT (Retail) 25.50 is support that goes back to 2012.
Volatility Index (VXX) Up 37% today.
Junk Bonds (JNK) 93.81 is the 2016 low.
LQD (iShs iBoxx High yield Bonds) 120 is a pivotal area.
Twitter: @marketminute
The author may have a position in the mentioned securities at the time of publication. Any opinions expressed herein are solely those of the author, and do not in any way represent the views or opinions of any other person or entity.


