When investors want to get a sense of the broader U.S. equities market, one index they analyze is the Wilshire 5000. The Index is made up of all American stocks actively traded in the U.S.
Simply put, this broad index is a gauge of market health and can provide insights into trends and potential reversals.
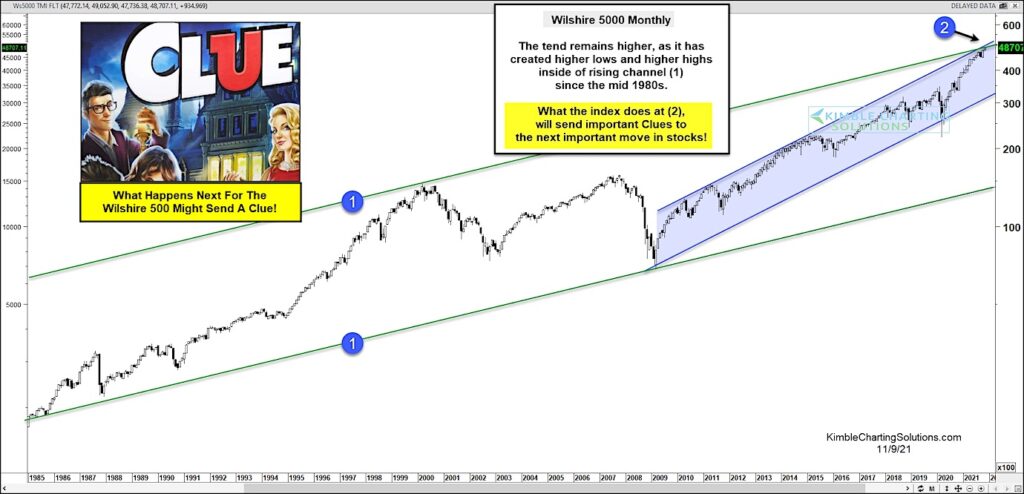
We look at the Wilshire 5000 today because it is at a critical inflection point.
As you can see on the long-term “monthly” Wilshire 5000 chart, the broader market has been in a strong up-trend. And the sharp turn higher out of the March 2020 low has sent the index soaring toward to new heights.
It is currently testing the top of a rising price channel – marked by each (1) – that goes back to the early 1980’s. This test or major price resistance comes into play at (2). Will it breakout? Take a breather? Reverse course and send the market lower?
Inquiring minds want to know…
No doubt about it, what the index does at (2) will send important clues to investors about the next move in stocks.
Note that KimbleCharting is offering a 2 week Free trial to See It Market readers. Just send me an email to services@kimblechartingsolutions.com for details to get set up.
Twitter: @KimbleCharting
Any opinions expressed herein are solely those of the author, and do not in any way represent the views or opinions of any other person or entity.
: Cup (and Maybe Handle) Watch")
 Trading Near Top Of Price Range")
 Reaches Important Price Support")
: Cup (and Maybe Handle) Watch")