The Wilshire 5000 stock market index is a broad gauge of the equity market.
During volatile / corrective times like today, we can analyze it to see where we are at.
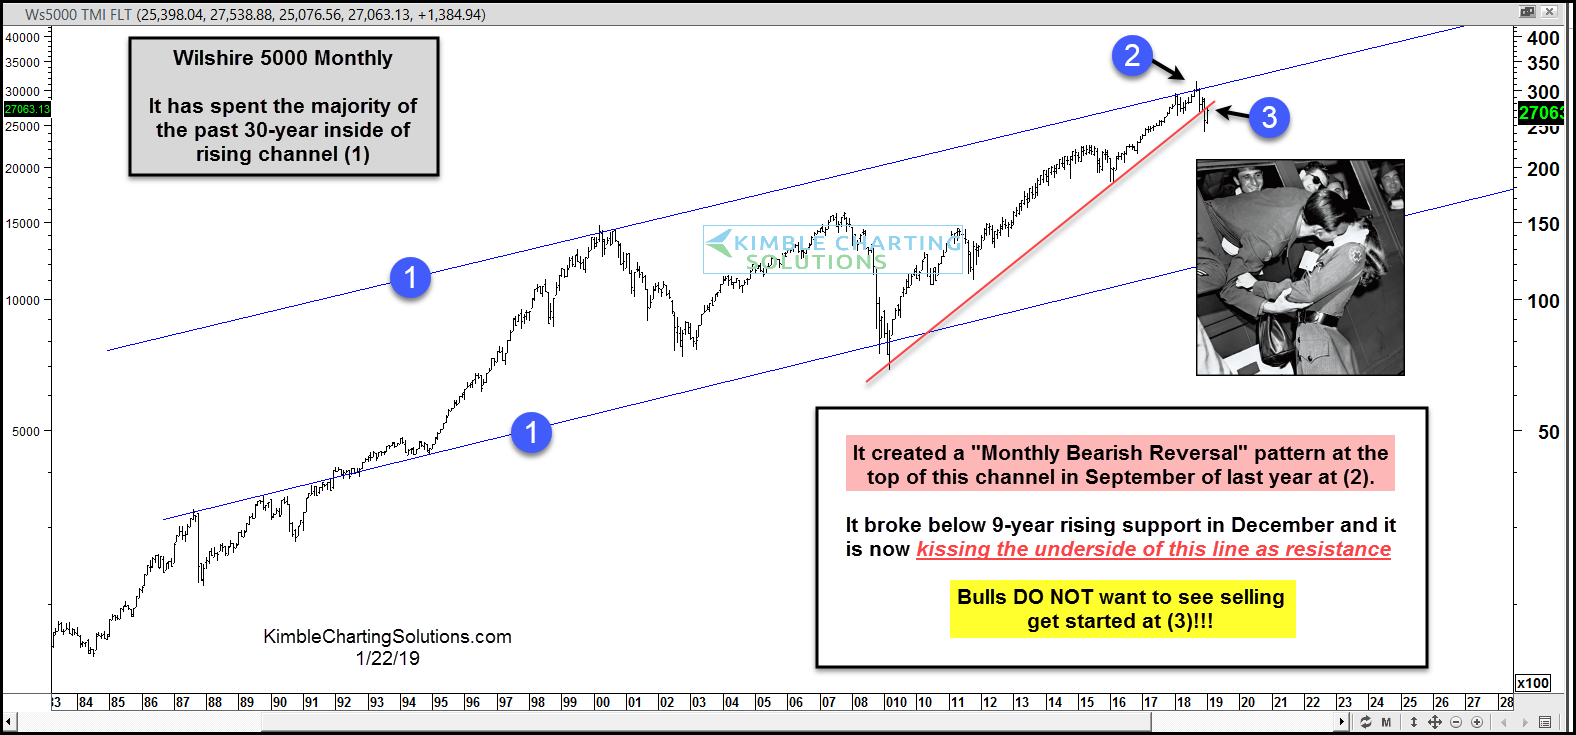
The chart below is a “monthly” chart of the Wilshire 5000.
As you can see, the Wilshire has remained within a 30 year rising channel (1).
Back in September, the broad equity index created a monthly bearish reversal at (2) before breaking below 9 year rising support in December (3).
The latest rally has the Wilshire kissing the underside of this broken trend line.
Bulls DO NOT want to see another reversal lower here. If selling begins to accelerate from (3), then bulls could be in trouble. Stay tuned!
Wilshire 5000 Index “Monthly” Chart
Note that KimbleCharting is offering a 2 week Free trial to See It Market readers. Just send me an email to services@kimblechartingsolutions.com for details to get set up.
Twitter: @KimbleCharting
Any opinions expressed herein are solely those of the author, and do not in any way represent the views or opinions of any other person or entity.


