Rising interest rates has created a decline in treasury bonds not seen in modern times.
Well, they say crisis equals opportunity.
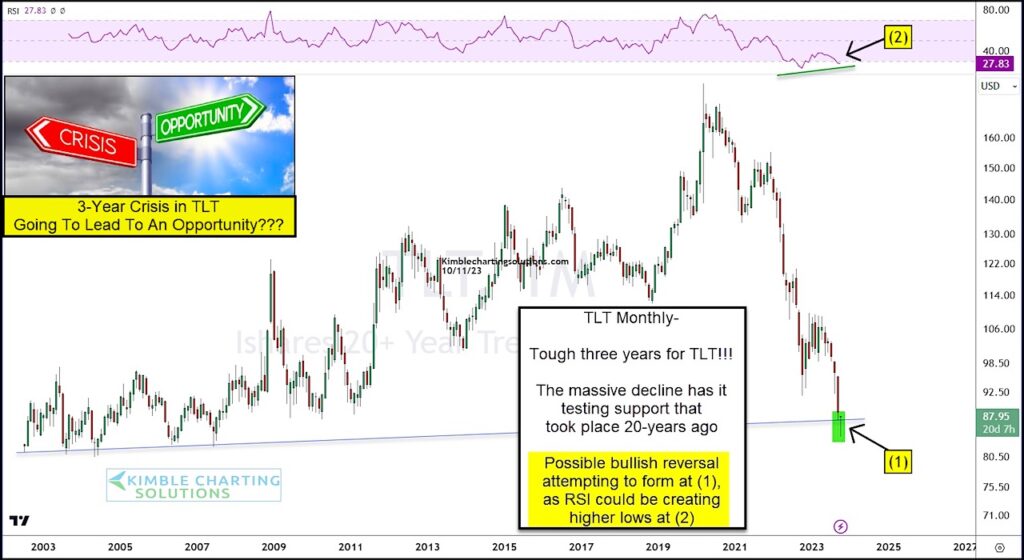
This may be the case today as we look at a long-term “monthly” chart of the 20+ Year Treasury Bond ETF (TLT).
As you an see, it has been a rough 3-years! And the crisis now has TLT testing 20-year trend support at (1).
It’s still early in the month, but TLT is attempting to form a bullish reversal at (1) while the Relative Strength Index (RSI) could be forming a higher low.
Opportunity for treasury bonds and TLT? If not, the crisis most likely gets MUCH worse. All eyes on support here and stay tuned!
$TLT 20+ Year Treasury Bond ETF “monthly” Chart
Note that KimbleCharting is offering a 2 week Free trial to See It Market readers. Just send me an email to services@kimblechartingsolutions.com for details to get set up.
Twitter: @KimbleCharting
Any opinions expressed herein are solely those of the author, and do not in any way represent the views or opinions of any other person or entity.


