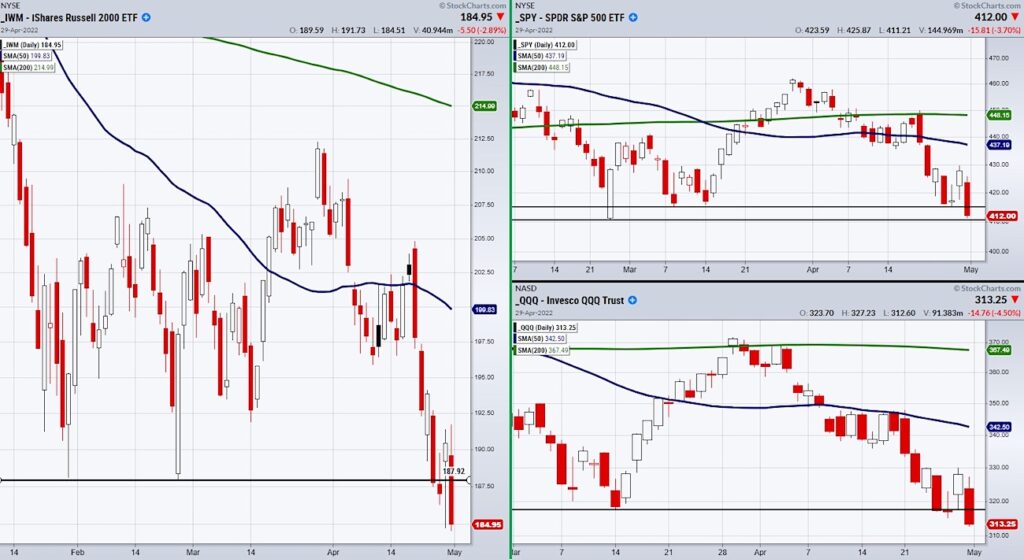
Friday, the Nasdaq 100 (QQQ) closed -4.4% on the day.
Not far behind came the S&P 500 (SPY) at -3.6% along with the Russell 2000 (IWM) at -2.8%.
This comes after each failed to hold support from previous lows dating back to mid-March.
While these technical levels were broken, the reason for the selloff and overall market weakness comes from more than a chartist perspective.
With that said, how should we prepare for Monday’s trading session when even safety plays such as precious metals look to be struggling.
When it comes to trading on Monday, we need to first watch for confirmation of the downside.
Black lines are drawn in the above charts of the QQQ, SPY, and IWM showing recently broken support levels that need to hold as new resistance levels.
However, if these levels are violated and the market continues to sit on the fence between breaking down and holding, sticking to the sidelines is not a bad option as we should only take trades when we see clear opportunity.
When it comes to picking a side, bearish sentiment is dominating.
Small rally days have been short-lived and met with heavy selling.
Even if a rally does follow through, overhead resistance from the downward slopping 50-Day moving average (blue line) will need to be dealt with.
Even the commodities space has been in a tough spot.
This is because rising inflation paired with a weak market has confused investors about how the Fed will react.
Some believe the Fed will alter rate hikes to help the market while others believe the Fed has been dovish far too long.
With that said, high inflation and a stagflation type of environment means we should continue to watch the commodities space for opportunities when the timing is right.
Therefore, we have our eyes on gold (GLD), Sugar (CANE), Invesco Agricultural ETF (DBA), and more.
Earnings Season Starts with a Bang! Watch Mish’s latest video on Stockcharts.com
Stock Market ETFs Trading Analysis and Summary:
S&P 500 (SPY) 414 pivotal.
Russell 2000 (IWM) 184 to hold.
Dow Jones Industrials (DIA) 326 next level to hold.
Nasdaq (QQQ) 317 pivotal or new resistance level.
KRE (Regional Banks) Needs to find support.
SMH (Semiconductors) 225.80 support.
IYT (Transportation) 239 support.
IBB (Biotechnology) Needs to find support.
XRT (Retail) 70 support.
Twitter: @marketminute
The author may have a position in mentioned securities at the time of publication. Any opinions expressed herein are solely those of the author and do not represent the views or opinions of any other person or entity.


: Creating Bullish Divergence?")


