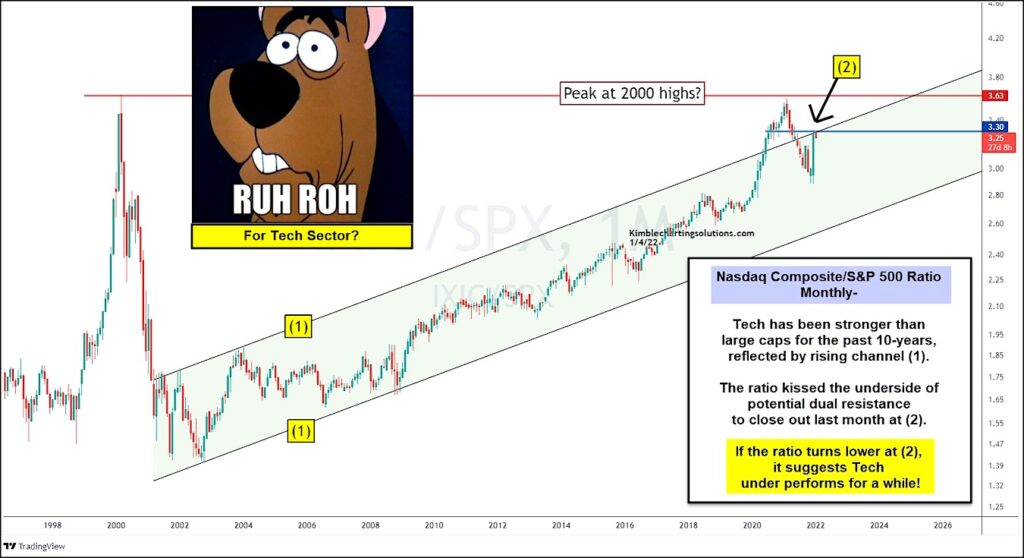
Tech stocks began under-performing the broader market several months ago when the ratio of the Nasdaq Composite to S&P 500 Index peaked out at the 2000 high.
This is worth noting because this tech ratio has been in a rising up-trend for the past two decades, highlighted by each (1) on today’s “monthly” chart.
While this suggests long-term strength, it doesn’t mean that strong pockets of under-performance (corrections) cannot emerge. This is exactly what we saw over the past year or so.
That said, tech stocks perked up into year-end, with the ratio kissing the underside of potential resistance to close out December at (2).
If the ratio turns lower at (2), it suggests that tech stock may under-perform for several more months. Stay tuned!
Note that KimbleCharting is offering a 2 week Free trial to See It Market readers. Just send me an email to services@kimblechartingsolutions.com for details to get set up.
Twitter: @KimbleCharting
Any opinions expressed herein are solely those of the author, and do not in any way represent the views or opinions of any other person or entity.

 Testing Important Price Support")
: Cup (and Maybe Handle) Watch")

