Back on June 30, I did a macro technical analysis of the major stock market indices asking the question: Is the broad stock market ready to breakout?
In asking that question, we discussed several stock indexes and highlighted on-going divergences (non-confirmations).
Today, we will provide an update on these divergences, while focusing on a “weekly” chart of the S&P 500 Index (INDEXSP: .INX), amongst others.
Currently, the bulls have made progress with the Dow Jones Industrials, NASDAQ, and S&P 500 making new all-time highs. The lone holdouts are the Russell 2000 and NYSE Composite. So, although the structure is bullish, it is still lacking risk-on confirmation. Again, this is from a very macro view. As you know, there is always a bull market somewhere… whether in certain stock indexes, sectors, stocks, or other asset classes.
Note that the following MarketSmith charts are built with Investors Business Daily’s product suite.
I am an Investors Business Daily (IBD) partner and promote the use of their products. The entire platform offers a good mix of technical and fundamental data and education.
S&P 500 “weekly” Chart
The S&P 500 pushed past 3000, closing the week at 3013. Sometimes markets struggle with breakouts over big round numbers (psychology). In this case, the S&P 500 will have to breakout over rising resistance (orange line in chart below). That resistance sits around 3050.
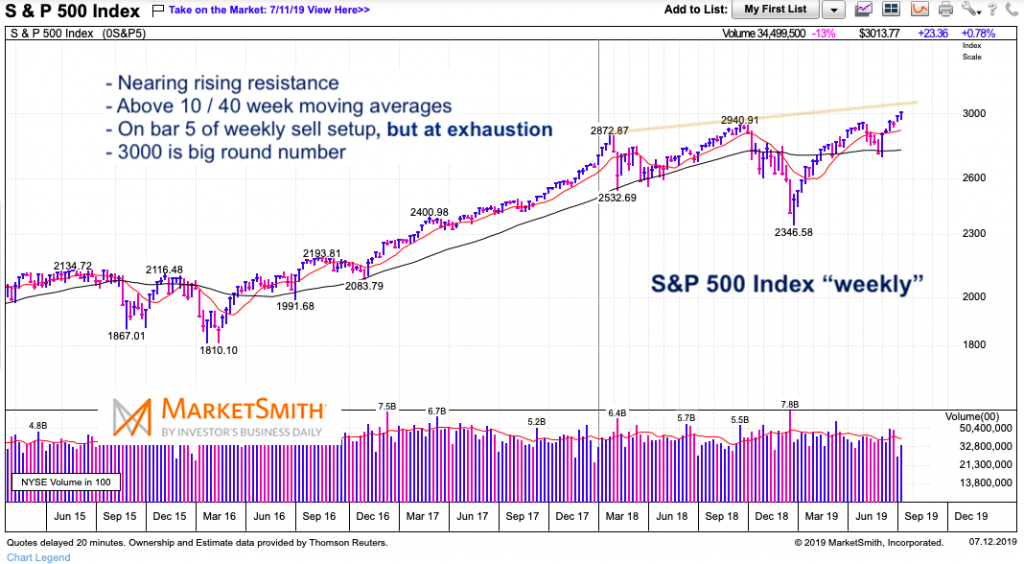
That said, the index is above its 10 and 40 week moving averages (bullish) and just recorded bar 5 of a weekly TD sell setup (this coming week is bar 6). This means that there is an outside chance that the rally lasts another 2-3 weeks before a more meaningful pullback in August. It’s also noteworthy that other TD exhaustion / overbought signals are present with price resistance sitting directly overhead. This may limit near-term upside to a couple percent, with downside well in excess of that number. Something to be mindful of.
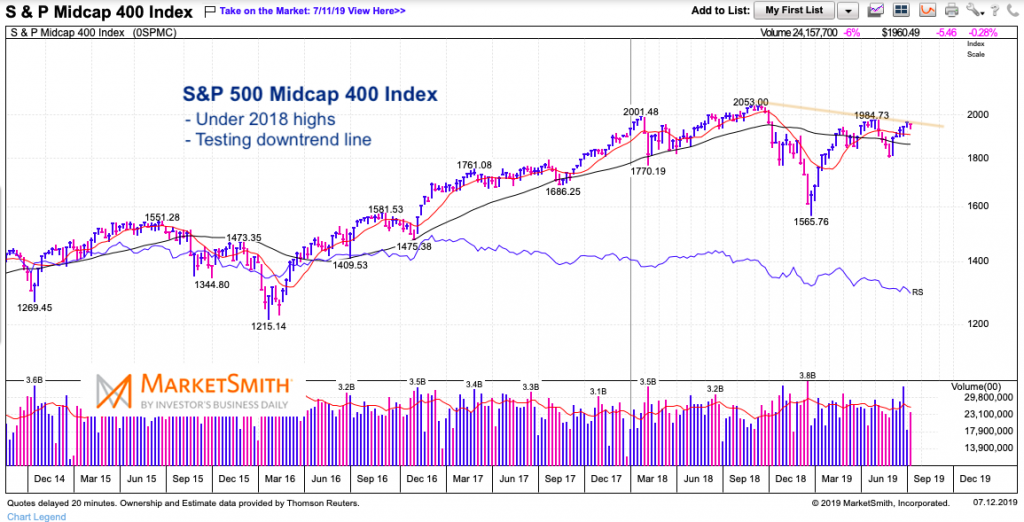
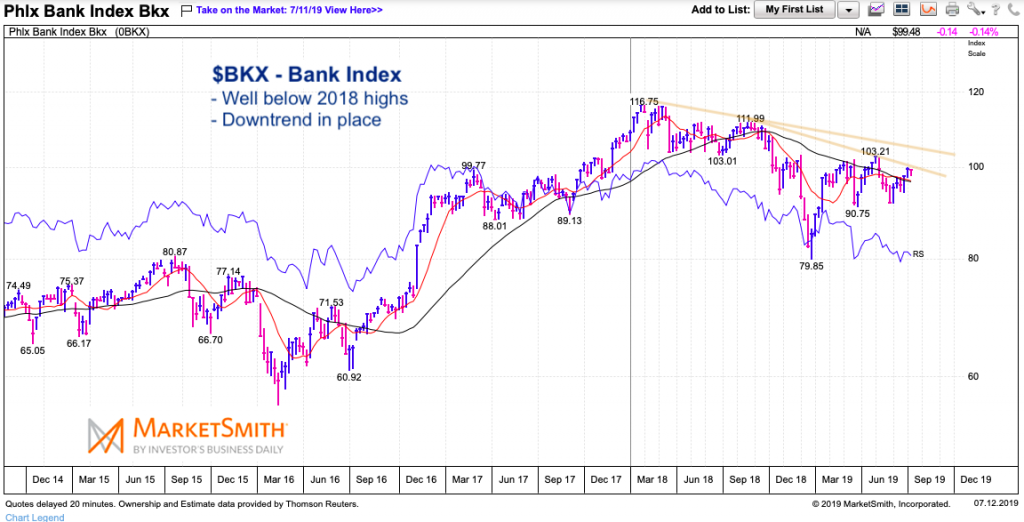
Other indexes offering up non-confirmation are the S&P Midcap 400 and the Bank Index:
Sentiment is also getting frothy. See the tweet below from fellow See It Market contributor and Baird senior strategist Willie Delwiche:
Stock market rally has washed out the remaining bears on the NAAIM survey (no respondents are net short). Both average and median exposure are back to early-May levels. Optimism seems to be getting more widespread. pic.twitter.com/uhpIyywOg7
— Willie Delwiche (@WillieDelwiche) July 11, 2019
Twitter: @andrewnyquist
The author may have a position in mentioned securities at the time of publication. Any opinions expressed herein are solely those of the author, and do not in any way represent the views or opinions of any other person or entity.

 Testing Important Price Support")
: Cup (and Maybe Handle) Watch")

