The month of June was a good one for stock market bulls.
Several records were set as market participants regained their mojo.
As we get ready to start a new month, only one question remains… is a major bull market breakout about to happen?
Some may argue that we’ve already broken out, or that a particular index has broken out. But I would say that a true unified market breakout can only occur with confirmation and agreement amongst the major indices. And right now, the S&P 500, Russell 2000, and Dow Jones Industrial Average have yet to breakout. And several important large cap tech issues continue to trade below their 2018 highs. Today, we put the spotlight on the Dow Jones Industrial Average (INDEXDJX: .DJI).
Note that the following MarketSmith charts are built with Investors Business Daily’s product suite.
I am an Investors Business Daily (IBD) partner and promote the use of their products. The entire platform offers a good mix of technical and fundamental data and education.
Dow Jones Industrials “daily” Chart
A one year “daily” chart of the Dow Industrials puts the focus on the 27000 level. That level gets adjusted a bit higher on the “weekly” chart below, but the point is that this very visible global index has yet to breakout.
That said, the past month has been very bullish and now has the index above its 50 and 200 day moving averages. AND it’s testing this breakout area.

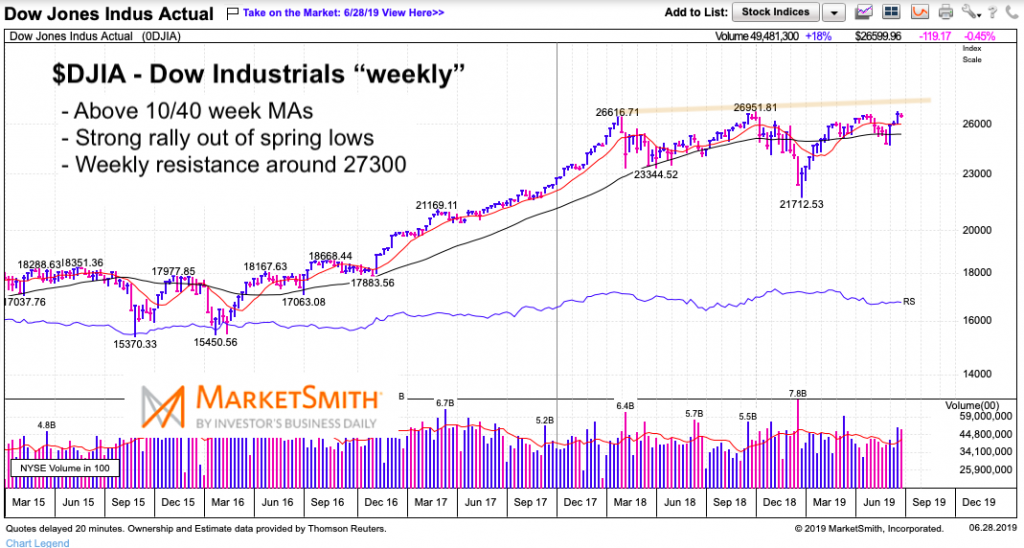
Dow Jones Industrials “weekly” Chart
The weekly chart tilts the resistance up to the 27300 level.
With momentum gathering, it’s likely that we will see the 27000 / 27300 levels tested. And after an 18 month sideways broad consolidation, this will be important to monitor. The bigger the base, the bigger the breakout. But will it happen now, or further down the road?
As this is focused on the Dow Industrials, I would also so this: Any breakout requires confirmation from other indices. AND throughout the past 18 months there have been several stocks that are in a bull market and making new highs (meaning that there are always opportunities / trades out there).
Twitter: @andrewnyquist
The author may have a position in mentioned securities at the time of publication. Any opinions expressed herein are solely those of the author, and do not in any way represent the views or opinions of any other person or entity.

 Rolling Over At Key Fibonacci Level?")


 Rolling Over At Key Fibonacci Level?")
