Monday mainly showed consolidation within the major indices.
The Russell 2000 (IWM) spent most of its time within Friday’s price range along with the S&P 500 (SPY) and the Nasdaq 100 (QQQ) having inside day chart patterns.
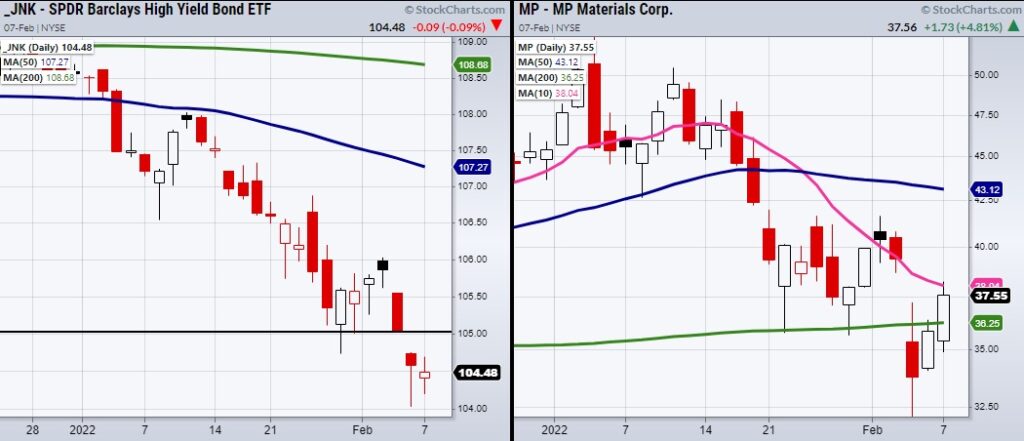
Along with the stock markets’ inconclusive price action, the High Yield Corporate debt ETF (JNK) is confirming that the best plan for trading is to wait for Tuesday.
Looking at the above chart of the JNK ETF, we can see an inside day chart pattern is created from Monday’s trading range fitting inside the trading range from last Friday.
With that said, if Monday was going to show a reversal pattern it would have closed over Friday’s highs at $104.75.
Additionally, we are still watching for JNK to fill its price gap from last Thursday’s low as seen by the black line in the above chart.
In the shorter term, we can now watch JNK to clear Friday’s high as a small breakout from Tuesday’s consolidative price action. This can give us confidence in taking trades that tend to closely follow the general markets’ price action as JNK is a good risk on or off indicator.
For trade ideas, MP Materials (MP) has an interesting setup.
Though it recently broke underneath its 200-day moving average at $36.25, MP is now back over the major moving average and looking to clear the 10-day moving average next at $38.04.
Fundamentally MP sits in a strong space as it’s one of North America’s largest mines for rare earth materials used in many devices from phones to electric vehicles.
With that said, technical analysis is key. Therefore, watch for MP to clear and hold over its 10-DMA along with JNK to either clear $104.75 or fill its gap for a strong buy signal at $105.02.
Stock Market ETFs Trading Analysis & Summary:
S&P 500 (SPY) Inside day. 472 is the price resistance level to clear.
Russell 2000 (IWM) Holding the 10-day moving average at 198.28
Dow (DIA) 353.25 is the price resistance level to clear.
Nasdaq (QQQ) 362 is price resistance.
KRE (Regional Banks) Now needs to hold over its 50-DMA at 72.16
SMH (Semiconductors) 284 is price resistance. 270 to price support.
IYT (Transportation) Holding the 10-day moving average but needs to close back over the 200-day moving average at 262.85
IBB (Biotechnology) 134.32 is the price to clear.
XRT (Retail) Needs to clear the 10-day moving average at 79.62
Twitter: @marketminute
The author may have a position in mentioned securities at the time of publication. Any opinions expressed herein are solely those of the author and do not represent the views or opinions of any other person or entity.


")


