This morning’s selling has the major stock market indices well into correction territory (and bear market territory for the Nasdaq and Russell 2000).
Today we look at the S&P 500 Index. And more precisely the mini futures contract for this index.
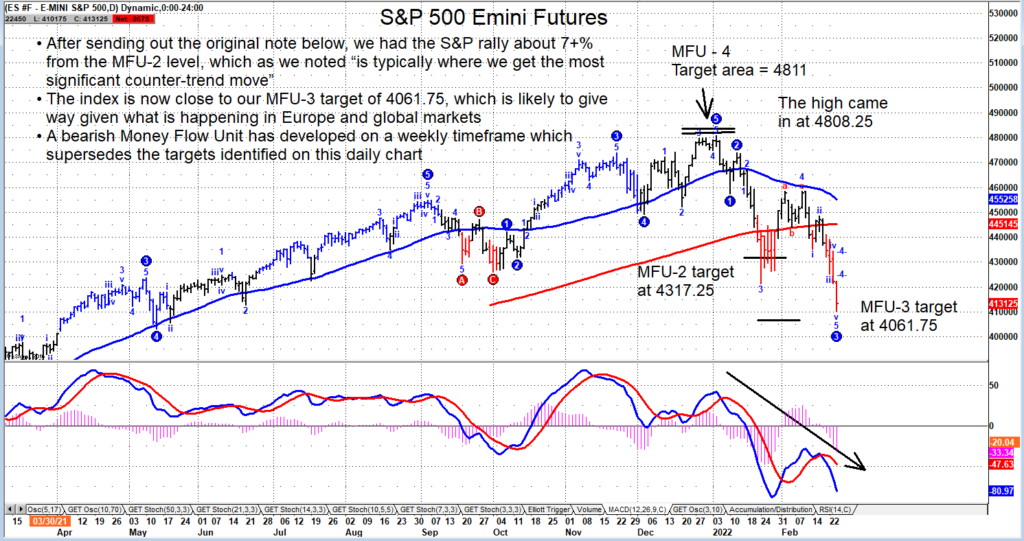
Below we show the “daily” chart of the S&P 500 Emini Futures which has the index trading very close to our MFU-3 target.
While this should elicit a bounce, we are becoming more concerned about the “weekly” chart of the S&P 500 Index. On the longer-term “weekly” chart, a pattern is forming with a bearish outlook after recent Money Flow Unit targets were generated that supersede what we have on a daily basis. These MFU targets are down at 3625 and 3029 but only have potential on a sharp move below 4000.
We must first see how the market reacts if/when 4061 is tested on the “daily” chart. I will keep you posted.
Note that this chart was created just prior to the open today, February 24.
S&P 500 Emini Futures “daily” Chart
Twitter: @GuyCerundolo
The author or his firm have a position in mentioned securities at the time of publication. Any opinions expressed herein are solely those of the author, and do not in any way represent the views or opinions of any other person or entity.

: Showing Some Signs of Emerging Strength")
