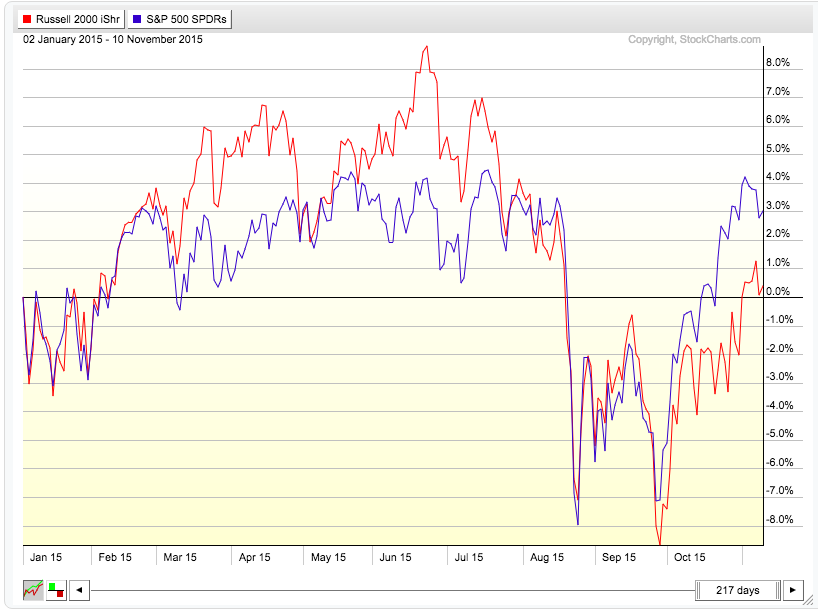
The first half of 2015 started so well for the small caps, climbing over 8% by early June and handily outpacing the large caps. But what a difference five months makes.
After the August sell-off and retest of the lows 5 weeks later, small caps stocks have struggled to stay in the green.
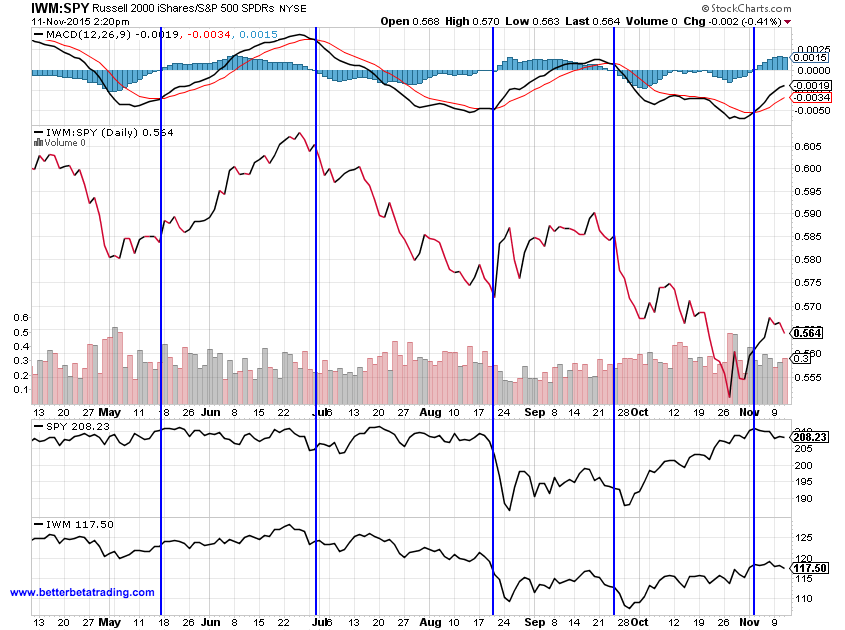
And investors are beginning to wonder if they’ll see a small caps rally into year end. Below is a look at the performance of the Russell 2000 ETF (IWM) vs the S&P 500 ETF (SPY). IWM represents small caps, SPY represents large caps
YTD Performance – IWM vs SPY
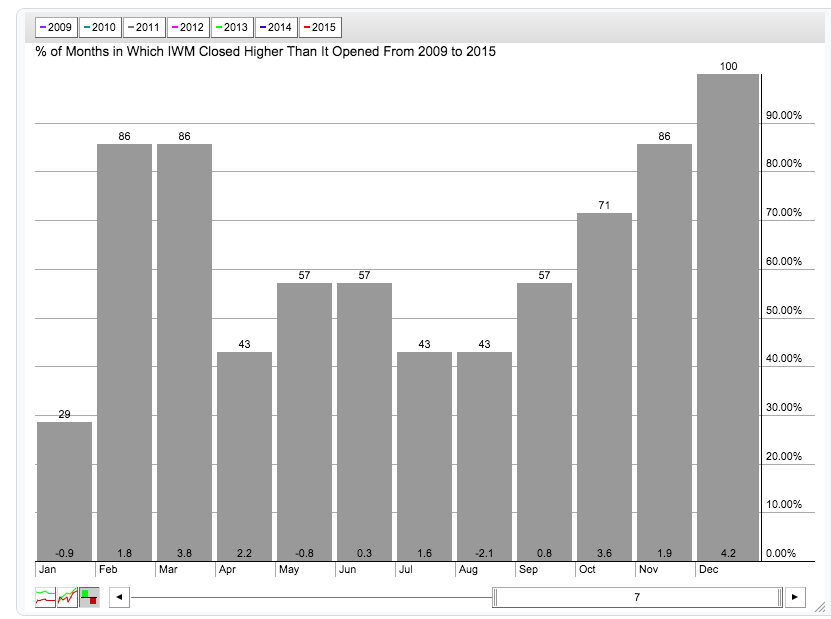
It’s a well known and generally reliable seasonal pattern that equities, and particularly small caps stocks, do well in the final three months of the year. This tendency has been rock solid since the 2008 financial crisis, with the small caps posting positive monthly numbers through the end of the year and investors seeing a small caps rally into year end. Will it be different this time?
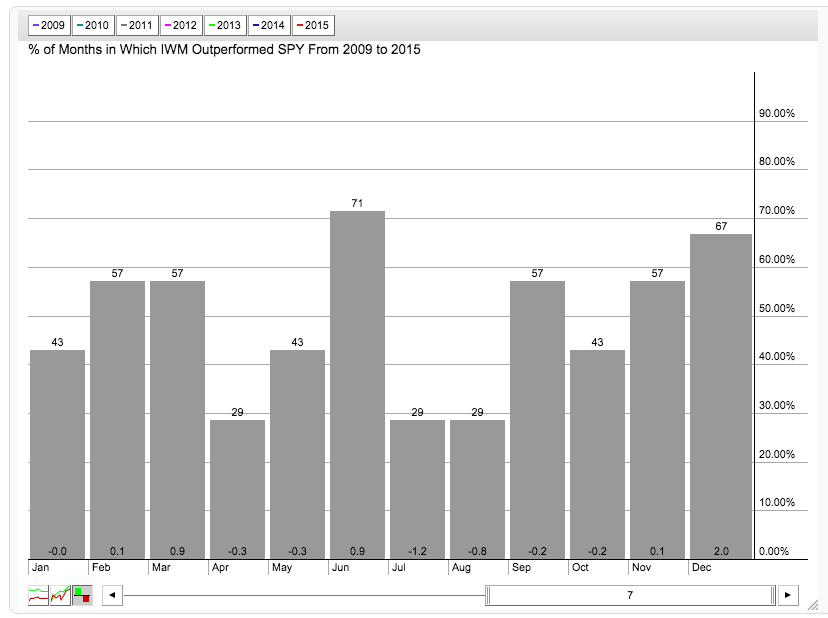
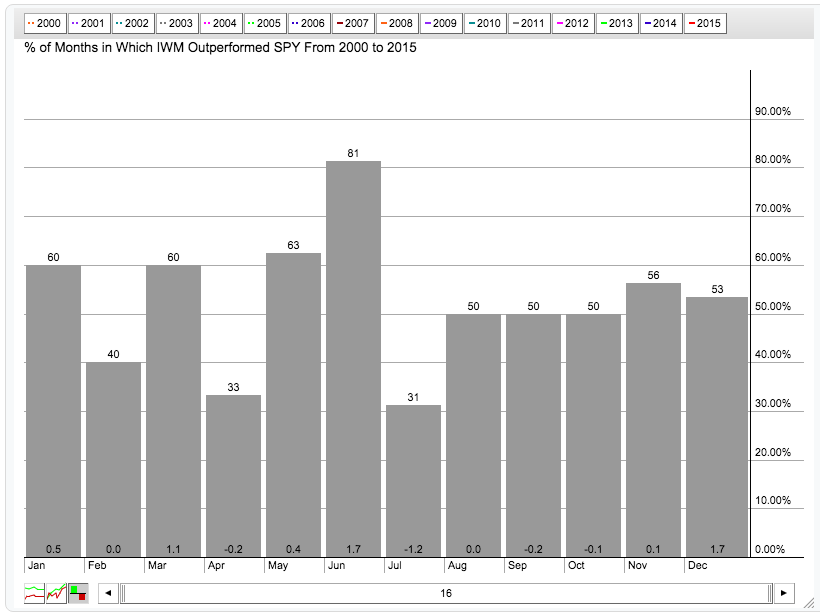
In addition to the strength of the small caps ETF (IWM) in the final months of the year, there is also a tendency for IWM to outperform the S&P 500 ETF (SPY) in November and December. The tendency has been more pronounced since 2008 and closer to even over a 15 year look-back period. This could bode well for a small caps rally into year end (or relative outperformance to SPY).
With the clear lag in the small caps stocks relative to the large caps stocks in 2015, this may be an opportunity to capitalize on the small cap seasonality by hedging a long IWM with a short SPY position. The ratio between the two appears to being climbing of late, due in large part to the range-bound price action of SPY. In the chart below, we can see the fairly regular intervals of MACD crossovers that correspond to trend changes in the ratio.
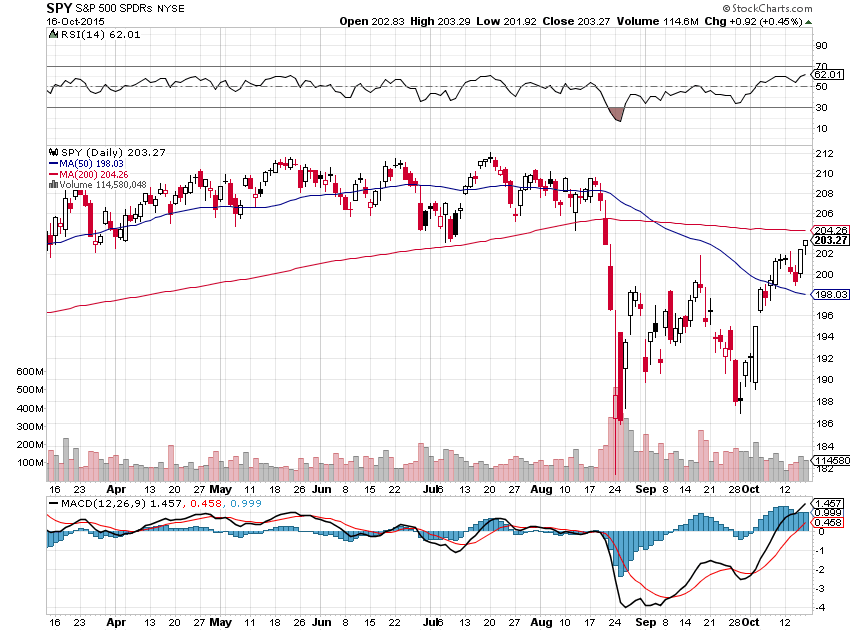
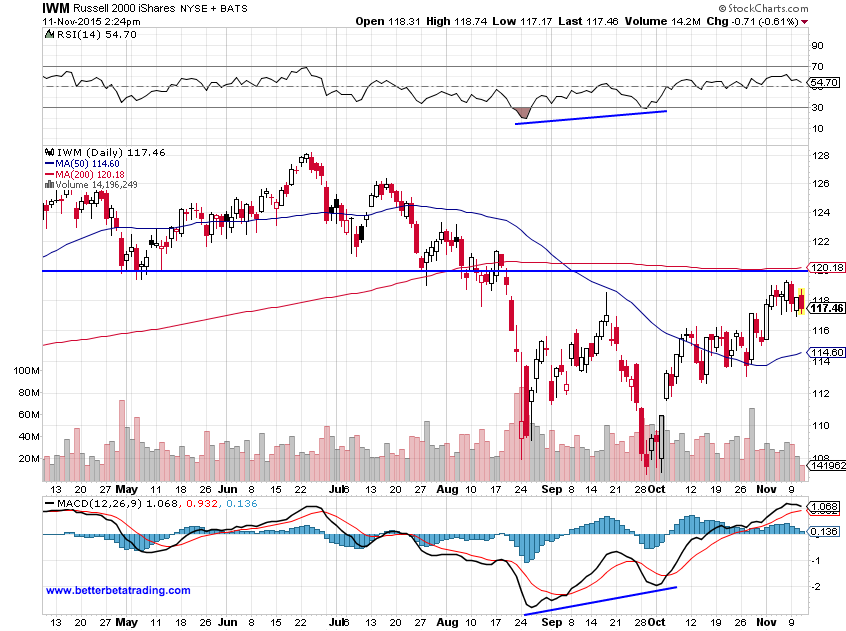
Beyond the seasonal patterns, it is worth noting the similarities between SPY in mid-October and the current position of IWM. In the charts below, we can see SPY sitting between the 50 MA and 200 MA, just below a key support level. Like the SPY chart from October 16, the IWM is in a similar no-man’s land between moving averages and beneath a significant level of prior support. The MACD and RSI readings are both positive but less “enthusiastic” than the SPY in October.
Will the small caps finish 2015 with a whimper or a roar? Seasonal patterns suggest that there may be an edge but, as we all know, consistent trading success lies in the details (structure, entry point, holding time, trading vehicles, etc.).
Good luck out there and thanks for reading.
The author has a net neutral position in IWM via options at the time of publication. Any opinions expressed herein are solely those of the author, and do not in any way represent the views or opinions of any other person or entity.


