Outperform vs. Underperform
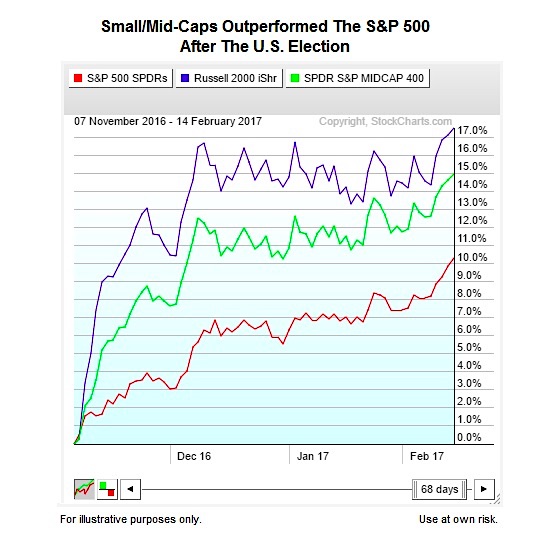
Outperformance occurs when asset A is more profitable than asset B. For example, small caps (blue) and mid caps (green) both outperformed the S&P 500 (red) between November 7, 2016 and February 14, 2017 (see graph below).
Note the red is the SPDR S&P 500 ETF (NYSEARCA:SPY); the blue is the iShares Russell 2000 ETF (NYSEARCA:IWM); and the green is the SPDR S&P Midcap 400 ETF (NYSEARC:MDY).
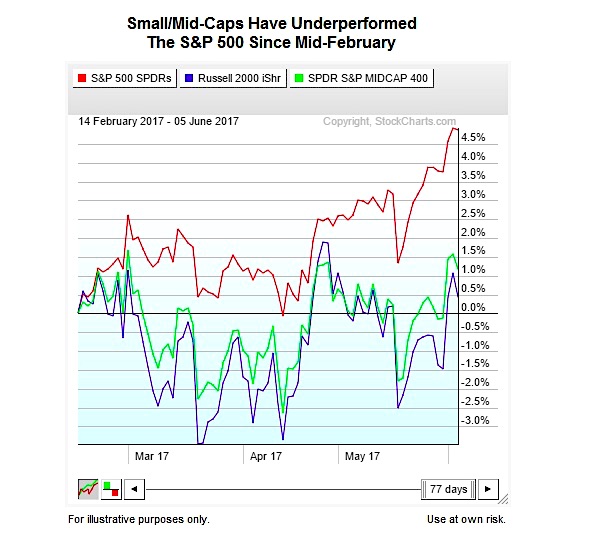
An asset that underperforms is not necessarily losing money or in a downtrend. Underperformance occurs when asset A makes less than asset B. For example, small caps and mid caps were both were profitable between February 14 and June 5, 2017; they were just not as profitable as the S&P 500 (SPY).
Odds Favor Continued Underperformance
Based on the facts we have in hand as of June 6, 2017, the odds favor continued underperformance of small caps and mid caps in the coming weeks and months. The graph below shows the 80, 90, and 100-day moving averages for the IWM:SPY ratio (measuring relative performance os small caps). Notice how a bearish flip was followed by several months of underperformance in late 2015/early 2016. A similar bearish flip recently occurred (right side of chart below). These charts speak to probabilities, rather than certainties.
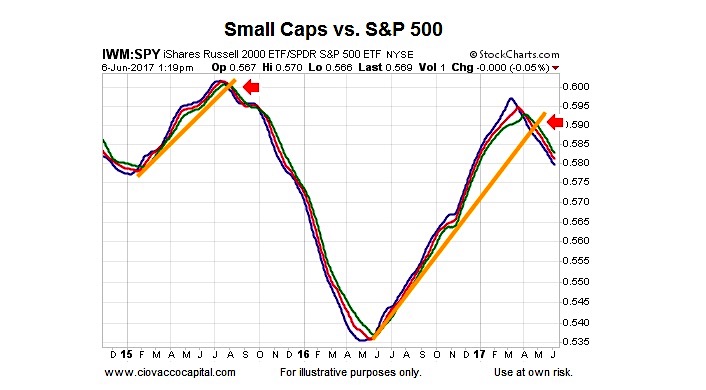
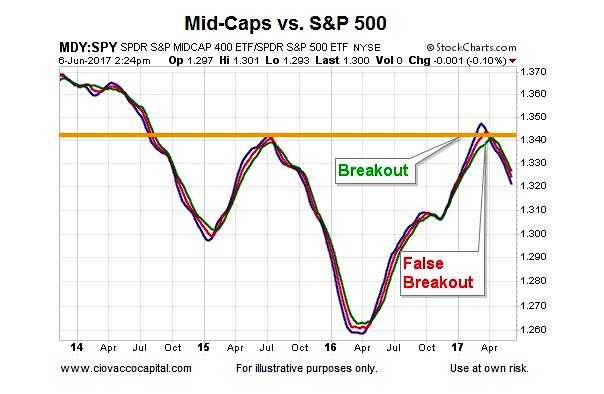
Also concerning is the recent false breakout look on many of the relative charts, such as the one shown below. False breakouts can be followed by sharp reversals. These charts tell us very little about the next few hours or next few days.
All Remain In Bullish Uptrends
It is important to note that small cap stocks and mid cap stocks remain on positive footing from a technical perspective (when viewed in isolation). For example, the charts below show a favorable bias based on the look of the 80, 90, and 100-day moving averages.
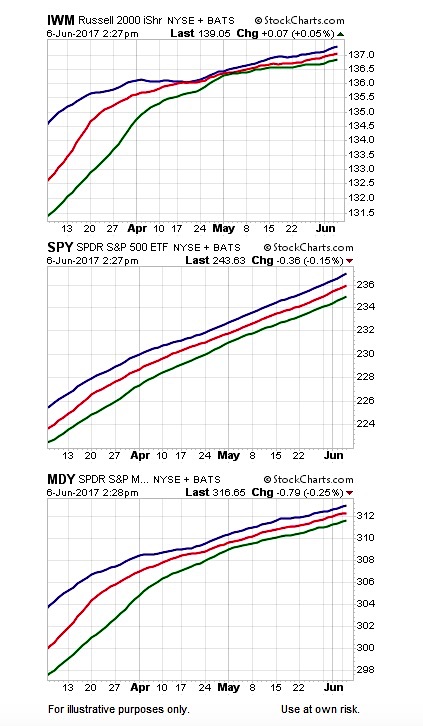
The hesitant look of the moving averages on the charts of the small caps (IWM) and mid caps (MDY) relative to the large cap index (SPY) speak to the waning momentum in small and mid cap stocks. The S&P 500’s trend by itself is on more stable footing.
Thanks for reading.
Twitter: @CiovaccoCapital
The author or his clients may hold positions in mentioned securities at the time of publication. Any opinions expressed herein are solely those of the author, and do not in any way represent the views or opinions of any other person or entity.


