Technology stocks lead the broader stock market on the way up… and, more recently, on the way down.
And within the technology arena, the same is true for the Semiconductors Sector (SMH).
To better understand the market’s direction (or change of direction) we watch the performance of leadership stocks and sectors. So today we provide an update on the Semiconductor Sector, and why investors need to tune in right now!
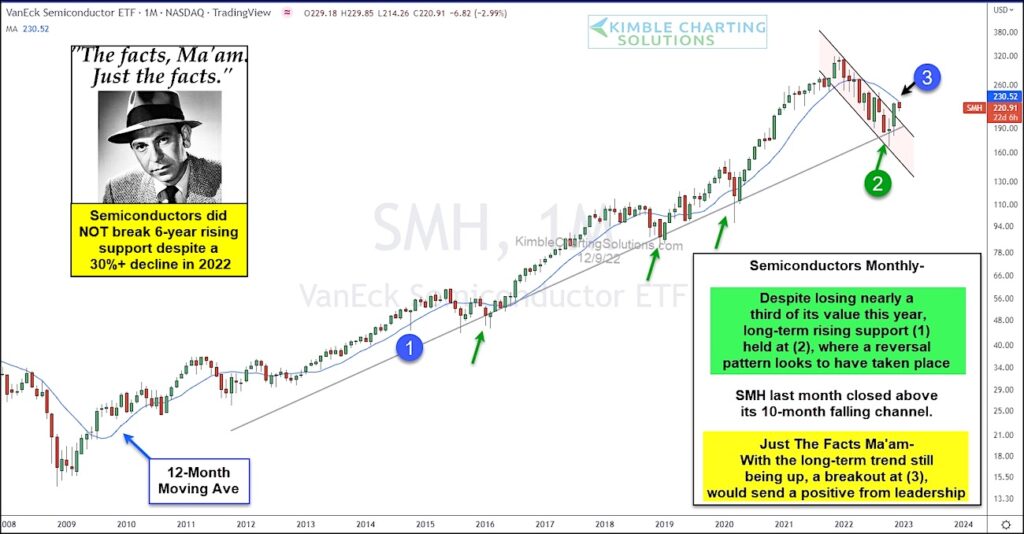
Looking at the long-term “monthly” chart of the Semiconductors (SMH), we can see the severity of this year’s decline (losing nearly a third of its value!). But we can also see that this leadership sector tested its long-term trend support at (1) and, while doing so, created a bullish reversal pattern at (2). Further strength lead to a November close above its 10-month downtrend channel.
It goes without saying that Semiconductor bulls would like to see follow through buying this month. And that leads to one more breakout test. SMH is currently testing the underside of its 12-month moving average at (3). A breakout and close above this level for December would be quite bullish. Stay tuned!
Semiconductors Sector (SMH) “monthly” Chart
Note that KimbleCharting is offering a 2 week Free trial to See It Market readers. Just send me an email to services@kimblechartingsolutions.com for details to get set up.
Twitter: @KimbleCharting
Any opinions expressed herein are solely those of the author, and do not in any way represent the views or opinions of any other person or entity.
: Creating Bullish Divergence?")


 and Semiconductors (SMH): Concerning Price Pattern?")


