Stocks were sold in September but have been trading somewhat sideways here in October.
There’s kind of an eerie, unknowing type vibe in the air with inflation, supply bottlenecks, and politics. Is an October surprise coming? Or perhaps an October rally?
Today we look at tech stocks and attempt to highlight defining price areas, as there are some big price levels to watch in the week ahead.
Note that the following MarketSmith charts are built with Investors Business Daily’s product suite.
I am an Investors Business Daily (IBD) partner and promote the use of their products. The entire platform offers a good mix of analysts, education, and technical and fundamental data.
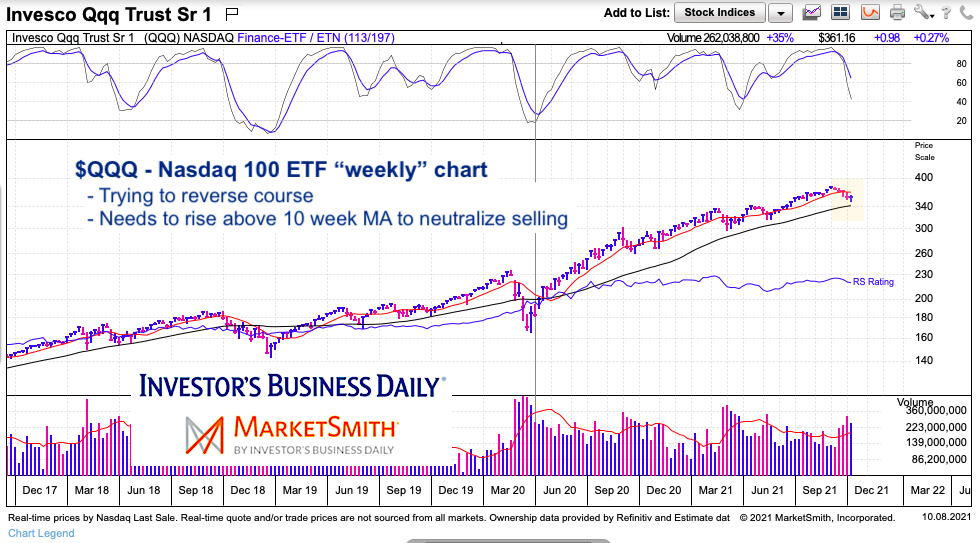
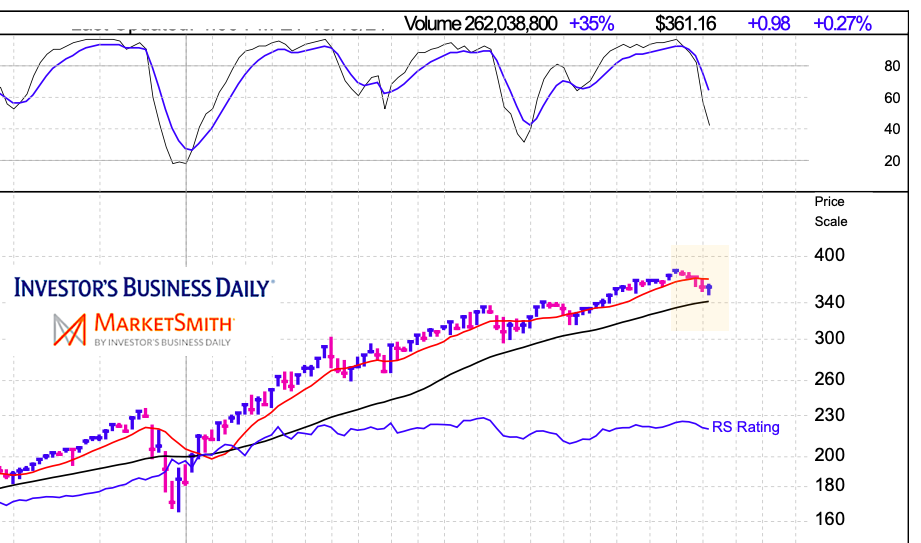
$QQQ – Nasdaq 100 ETF “weekly” Chart (two zooms)
A quick look at the “weekly” chart shows that price is attempting to stabilize. A move below last week’s lows would be bearish. A move back above the 10-week average ($370) would be bullish. Momentum still falling…
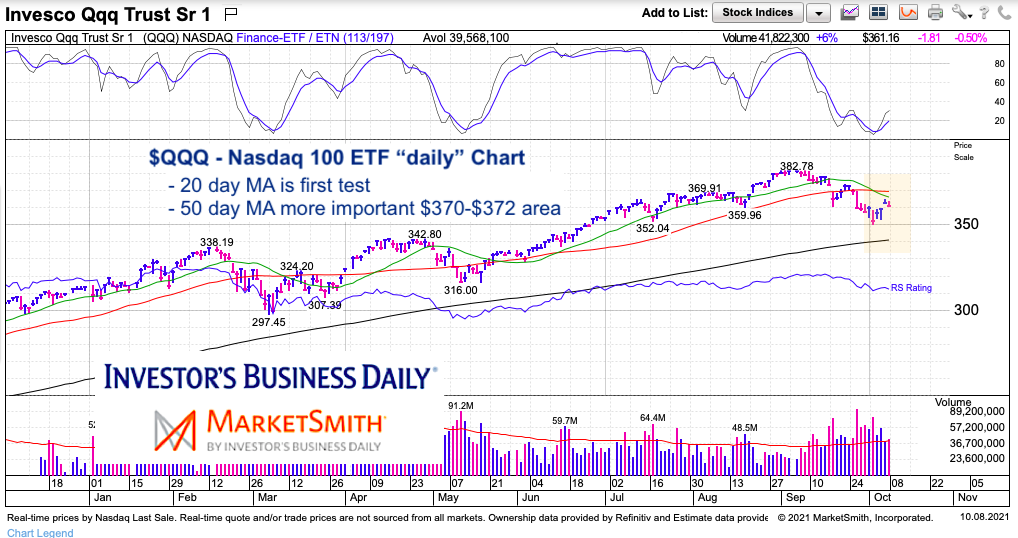
$QQQ – Nasdaq 100 ETF “daily” Chart
On the daily chart we can hone in and clarify levels to watch. A move over the 20-day moving average would neutralize the selling (at least temporarily). But the big test comes in at the 50-day moving average at $370 (along with the prior highs just above that).
Twitter: @andrewnyquist
The author may have a position in mentioned securities at the time of publication. Any opinions expressed herein are solely those of the author, and do not in any way represent the views or opinions of any other person or entity.
: Creating Bullish Divergence?")


 and Semiconductors (SMH): Concerning Price Pattern?")


