This week I put on a webinar during which I shared a number of positive stock market seasonality studies. Taken together, these studies highlight seasonal stock market strength that starts now and runs through the end of April.
Now this doesn’t mean that there are any guarantees, nor does it mean that the market won’t see any pullbacks during seasonal strength. But historically speaking, it has paid to be on board during this time period, rather than fighting it.
That said, market seasonality isn’t enough. It’s important to understand the current market environment.
The stock market has run up quite a bit in October and likely needs some room to breathe. But this comes as the major stock market indices are nearing critical technical resistance levels for investors.
The chart below highlights some major overhead resistance levels for 3 major stock market indices. Further, we may see some sideways chop until the market proves it can break above these levels. In most instances, these technical resistance levels are just a few percent away.
Dow Jones, S&P 500, Nasdaq Composite – Major Overhead Resistance Levels
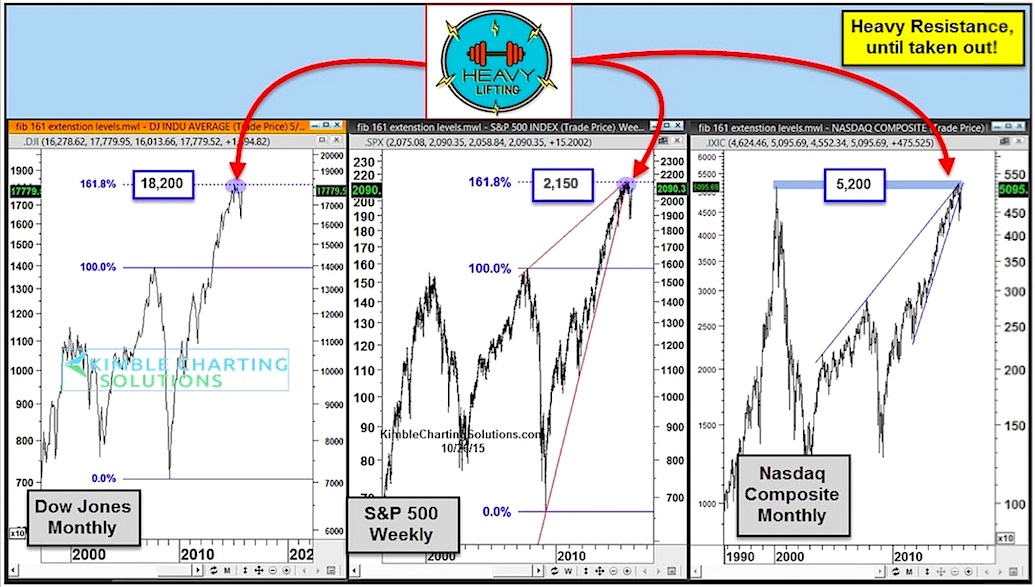
If the price action pushes the major stock market indices above these resistance levels, then odds are favorable that market seasonality patterns will impact the markets (yet again).
But until then, these levels will remain heavy resistance and should be respected.
Thanks for reading.
Twitter: @KimbleCharting
Any opinions expressed herein are solely those of the author, and do not in any way represent the views or opinions of any other person or entity.


