I think everyone will agree that the transportation sector is an integral part of the U.S. economy.
When they are trending higher, the economy is in good shape… and when they head lower, the economy is typically slowing. Well, today we have a very concerning case of the latter.
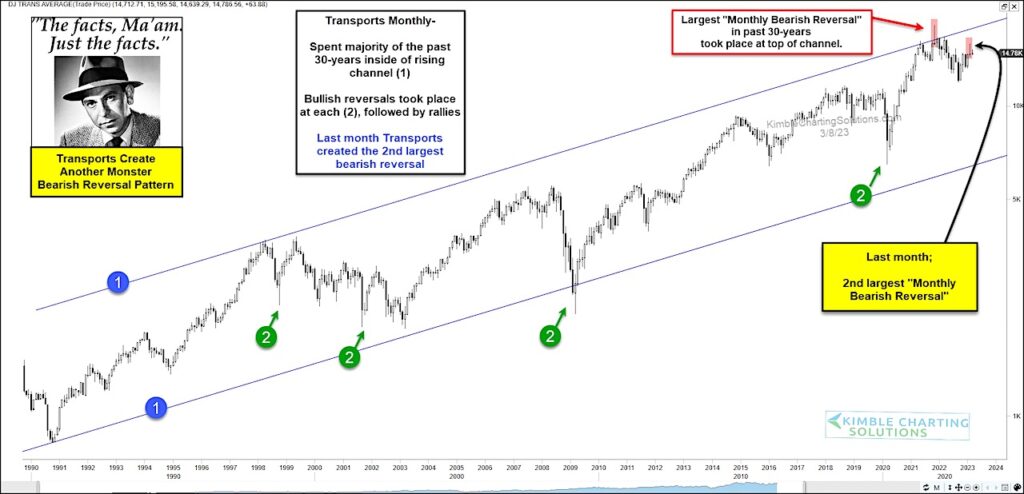
“The facts, Ma’am. Just the facts.”
Today’s chart is a long-term “monthly” chart of the Dow Jones Transportation Average that highlights a 3 decade rising price channel at each (1).
Also notice that the channel is pretty wide and there’s a lot of room from top to bottom (more on that in a moment).
Along the way, we have seen bullish reversals at each (2) that have been followed by big rallies. And over the past year, we saw price hit the top of the trading channel (resistance) and reverse lower. But this wasn’t any old bearish reversal… it was the largest “monthly bearish reversal” in the past 30 years for the transports!
Clearly, this reversal is concerning in and of itself (note the ensuing selloff). Well, those concerns just became a whole lot more concerning. Last month, the Dow Transportation Average put in its second largest bearish reversal! That’s right, two historic bearish reversals.
Might this bearish reversal be followed by another selloff? Stay tuned!
Dow Jones Transportation Average “monthly” Chart
Note that KimbleCharting is offering a 2 week Free trial to See It Market readers. Just send me an email to services@kimblechartingsolutions.com for details to get set up.
Twitter: @KimbleCharting
Any opinions expressed herein are solely those of the author, and do not in any way represent the views or opinions of any other person or entity.


