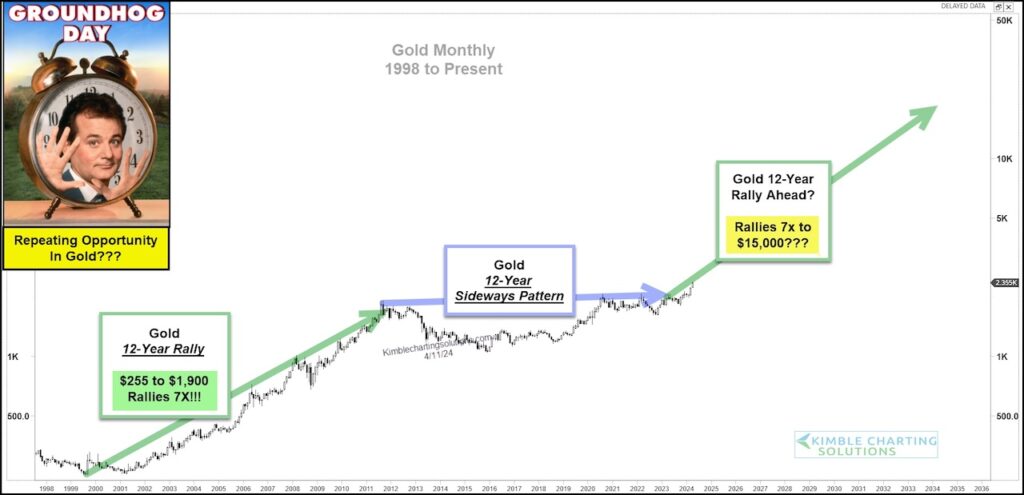
Gold spent the better part of the past 12 years trading in a wide sideways pattern.
This type of price action tends to drive away speculators (and even some convicted bulls). It also meant gold wasn’t getting many “sexy” headlines as investors weren’t overly bullish.
Until now. After a major breakout and move higher, Gold is finally getting some attention. And if today’s cycle pattern proves true, there may be a lot more attention (and investors) in the future for Gold.
Today’s “monthly” chart of Gold prices highlights a 12 year cycle pattern. As you can see, 12 years higher, followed by 12 years sideways, and now (perhaps) 12 years higher.
If this repeating pattern in Gold holds true, it could offer active investors opportunities now and in the future. Stay tuned!
Gold Price “monthly” Chart
Note that KimbleCharting is offering a 2 week Free trial to See It Market readers. Just send me an email to services@kimblechartingsolutions.com for details to get set up.
Twitter: @KimbleCharting
The author may have a position in mentioned securities. Any opinions expressed herein are solely those of the author, and do not in any way represent the views or opinions of any other person or entity.

: Worrisome to Broader Market?")


