I have spent a lot of time discussing the bullish implications of Gold price patterns and the recent Gold breakout attempt.
So why not offer up yet another example of why Gold (and precious metals partner, Silver) are brimming with bullish possibilities.
For reference, here are a couple of recent articles: “Silver Breakout Adds to Massively Bullish Price Pattern!” and “Is the Gold Miners ETF Ready To Blast Off Higher?“.
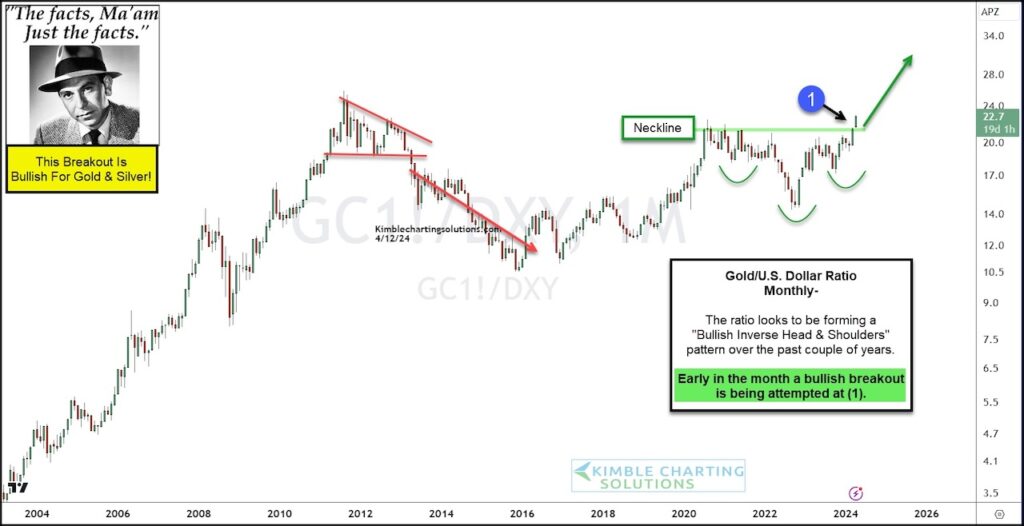
Today’s chart highlights the long-term “monthly” closing ratio of the price of Gold to the US Dollar. And unsurprisingly, the price patterns are historic and very bullish.
“The facts, Ma’am. Just the facts.” – Joe Friday
We have a large cup that began forming when Gold broke down and out of a bearish triangle (see red lines). Then came the rally into 2020. Since then a handle has formed over the past 4 years (green lines) in the form of an inverse head and shoulders – also bullish.
And now we are seeing Gold attempt a historic breakout at (1).
If this sticks, Gold will have a lot of room to run! Stay tuned!
Gold to US Dollar “monthly” Ratio Chart
Note that KimbleCharting is offering a 2 week Free trial to See It Market readers. Just send me an email to services@kimblechartingsolutions.com for details to get set up.
Twitter: @KimbleCharting
The author may have a position in mentioned securities. Any opinions expressed herein are solely those of the author, and do not in any way represent the views or opinions of any other person or entity.

: Worrisome to Broader Market?")


