Precious metals enjoyed a resurgence in October and November. And this had both Gold and Silver bulls looking for a major breakout.
Once, twice, three times… how many times the charm?
Well, needless to say, the rally hit a major hurdle once again this past week.
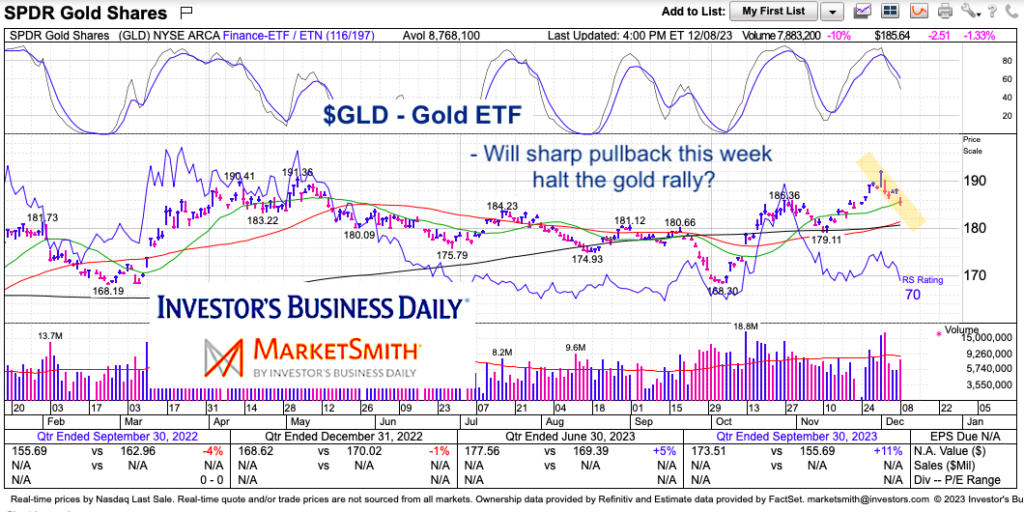
Today we look at a “daily” chart of the Gold ETF (GLD). A -1.3% decline on Friday punctuated a rough week where GLD fell over 3 percent.
Note that the following MarketSmith charts are built with Investors Business Daily’s product suite.
I am an Investors Business Daily (IBD) partner and promote the use of their products. The entire platform offers a good mix of tools, education, and technical and fundamental data.
$GLD SPDR Gold ETF Chart
GLD is currently testing its 20-day moving average. This is a good test of near term trend support. Below that and the 50/200 day moving averages (and prior low) come into play around $179-$181. This level is important support for December. Below that and we may see a sharp decline into January.
Twitter: @andrewnyquist
The author may have a position in mentioned securities at the time of publication. Any opinions expressed herein are solely those of the author, and do not in any way represent the views or opinions of any other person or entity.

 Testing Important Price Support")
: Cup (and Maybe Handle) Watch")

