It’s been a rough past few weeks for the Gold Miners ETF (GDX).
A bearish reversal in April has sent shares spiraling into May, down nearly 25%.
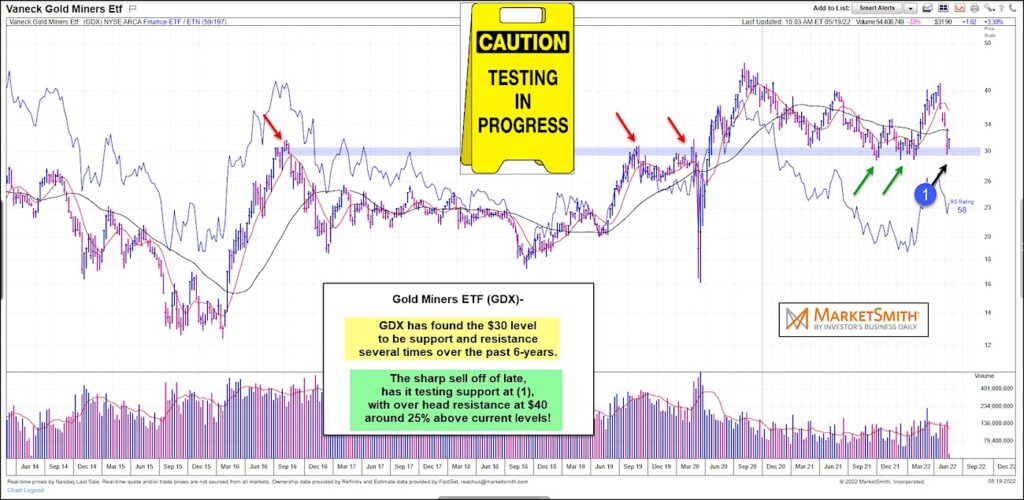
Today’s “weekly” chart of the Gold Miners (GDX) highlights this reversal, as well as important technical support.
As you can see, GDX has come down sharply of late. But what’s important to note here is that the Gold Miners are testing critical price support at (1). As you can see, GDX is trading near the $30 level that has been price support and resistance several times over the past 6 years.
Will the sharp selloff continue to head lower and break this key support? Or will support hold and perhaps send GDX back up toward resistance near $40 once more? Stay tuned!
$GDX Gold Miners ETF “weekly” Chart
Note that KimbleCharting is offering a 2 week Free trial to See It Market readers. Just send me an email to services@kimblechartingsolutions.com for details to get set up.
Twitter: @KimbleCharting
Any opinions expressed herein are solely those of the author, and do not in any way represent the views or opinions of any other person or entity.

 Flirting With Critical Support… Again")


