Just as the stock market rally seems to be gaining some traction, investors check their calendars and see next week’s Federal Reserve meeting.
And it couldn’t come at a more important time for financial stocks, and by extension, the broader market.
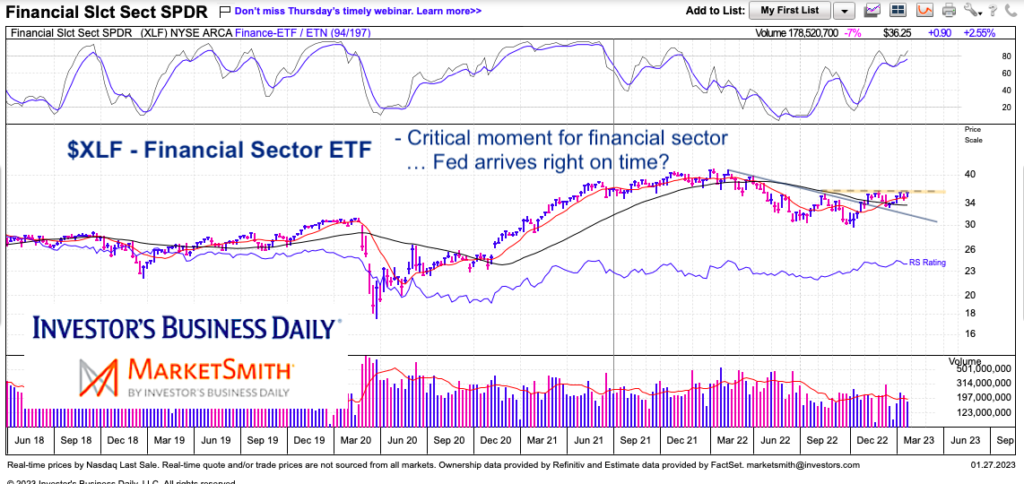
Today we shine a spotlight on the “weekly” chart of Financial Sector ETF (XLF) and discuss why it is at a critical juncture.
Note that the following MarketSmith charts are built with Investors Business Daily’s product suite.
I am an Investors Business Daily (IBD) partner and promote the use of their products. The entire platform offers a good mix of tools, education, and technical and fundamental data.
$XLF Financial Sector ETF “weekly” Chart
As you can see, XLF broke above its down-trend line before consolidating over the past several weeks. During this consolidation, XLF failed to convincingly breakout above its August high in December and currently is retesting those highs. That resistance ($36.00-$36.50) is even more important to watch over the next week as the Federal Reserve meeting takes shape. I’m sure it will be noisy with some price swings but I’ll be watching where XLF closes for the week. A breakout that sticks would be very bullish, while a reversal lower would be bearish.
Twitter: @andrewnyquist
The author may have a position in mentioned securities at the time of publication. Any opinions expressed herein are solely those of the author, and do not in any way represent the views or opinions of any other person or entity.

: Showing Some Signs of Emerging Strength")

