Smokey the Bear originated in New Mexico in 1950. A major wildfire in the Capitan Mountains brought firefighters to the scene.
As the crew battled to contain the blaze, they received a report of a lone bear cub seen wandering near the fire line. A forest ranger found the poor little dude in a tree, charred and burned.
He drove the cub to Santa Fe, where he was treated for massive burns. After he healed, he was sent to a zoo, where he lived until his death in 1976.
Hence, the popular anthem Smokey the Bear was born.
What does this have to do with the photo and the stock market?
The beak represents the decay of stock market bears over the last 3 months.

As far as the stock market, with all major stock indices closing red on Friday, will the decaying bears come back to life?
The overall picture of the 6 ETFs that represent our investing family of the U.S. economy does not look bad. In fact, one could say that the red close Friday on all 6 ETFs is nothing more than a healthy pullback / correction.
So with that in mind, starting with the top left, Semiconductors ETF (SMH), after a doji candle last week, this week we have a bearish engulfing pattern.
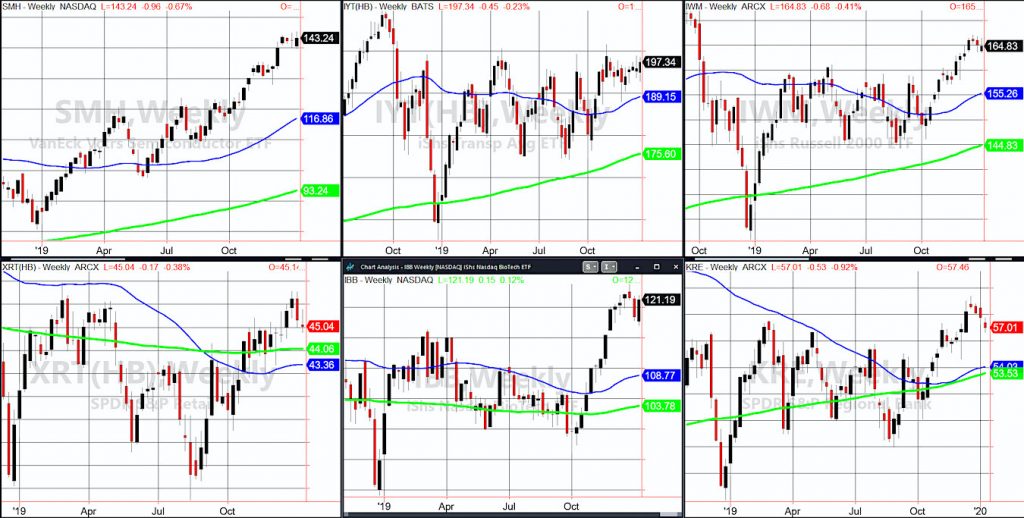
In English, that means that after squeaking out a new all-time high, SMH closed in the lower end of the trading range for the week. A move under 139.77 – this week’s low – should be duly noted as possible exhaustion.
Top middle is the Transportation Sector ETF (IYT). Another weekly bearish candlestick, the 200 level continues to elude our very important sector. However, IYT made up some necessary ground this week. Now, it should hold 195 or we will be back looking at 190.
Far right top row is the Russell 2000 (IWM). Looking more like a gentle correction than a top, need I remind you that it continues to lag way behind the S&P 500.
Bottom left is the Retail Sector ETF (XRT). News of Macy’s, Pier One closing stores along with Bed Bath and Beyond’s earnings woes, brick and mortar is our weakest link. Until XRT can make a stand over 46.00, we look at this as the slowing economy broadcast.
Middle bottom is the Biotechnology Sector ETF (IBB). The weekly chart shows a classic middle finger formation. Unless it clears 122, that could mean lower levels. Furthermore, it could signal the coming end of the market euphoria.
Finally, we have Regional Banks ETF (KRE). Next week starts bank earnings season. KRE’s weekly charts also looks more like a correction than a top. However, on the daily chart KRE sits right on the 50-DMA and is flirting with an unconfirmed caution phase. A move under 55.95 should yield more selling.
As equities have gotten hot enough to start a forest fire, with this correction, we may have smoked out the bears from hibernation. Nevertheless, bears ought to take heed so they do not get burned again.
And bulls, also take heed as the jobs report indicates what I believe is coming- a slowing economy and rising inflation.
In case you missed it-Here is a link to my RealVision segment from January 7th:
https://www.realvision.com/mega-trends-seasonality-and-earnings-season
S&P 500 (SPY) The makings of a reversal pattern if 323.62 fails.
Russell 2000 (IWM) Failed the 10-day moving average and must hold 163.70 price support or we are looking at 161.90 next.
Dow Jones Industrial Average (DIA) The makings of a reversal pattern and bearish engulfing one as well. 286.88 is the price support to watch.
Nasdaq (QQQ) The makings of a reversal pattern and bearish engulfing one as well. 215.44 is pivotal price support for traders.
KRE (Regional Banks) Sitting right on the 50-day moving average. This is a must watch price area on Monday.
SMH (Semiconductors) Possible reversal pattern with support right at Friday’s low that must hold by the Monday’s close to avoid more selling.
IYT (Transportation) 195 is a pivotal price area. 200 is key price resistance.
IBB (Biotechnology) 121.91 is price resistance and 115.50 support.
XRT (Retail) 45.41-46.00 is pivotal price resistance. 44.78 is the 50-day moving average.
Twitter: @marketminute
The author may have a position in the mentioned securities at the time of publication. Any opinions expressed herein are solely those of the author, and do not in any way represent the views or opinions of any other person or entity.


