Everyone loves a comeback story and commodity ETFs are starting to show positive signs of burgeoning momentum this year. The persistent selling in precious metals, energy, and agriculture may finally be ready for a notable turn that builds into a new sustainable uptrend.
While many investors may choose to play a specific sector in this mix, others will prefer the diversified nature of broad-based funds that track the entire group. This post is dedicated to breaking down the largest and most common commodity ETFs and ETNs… in short, those ETFs that track the physical commodities world.
KNOW WHAT YOU OWN: COMMODITY ETFs
Reviewing The Playing Field – David Fabian
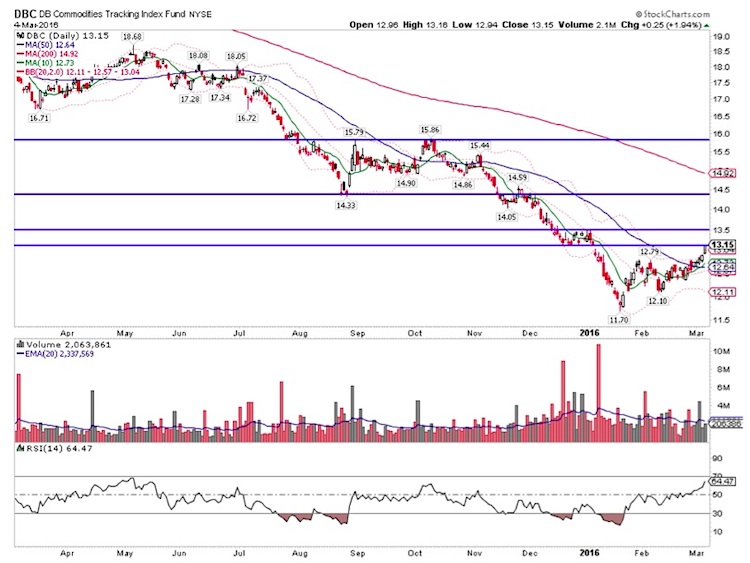
The largest and most well-known vehicle in this field is the PowerShares DB Commodity Index Tracking Fund (DBC). This ETF tracks 14 of the most liquid and heavily-traded physical commodity futures contracts in the world.
The top five constituents of this index by weight are: gasoline, brent crude oil, gold, heating oil, and light crude oil. Together these holdings make up 52.44% of the total DBC portfolio. As you can see, energy takes a prominent spotlight in this mix despite its recent slide.
DBC charges an expense ratio of 0.89% and has total assets under management of $1.9 billion. It’s also worth noting that this fund is structured as a partnership in order to participate in the futures markets. This means that any shareholders of the fund will receive a K-1 at the end of the year that doesn’t correlate with traditional capital gains or losses in your actual investment.
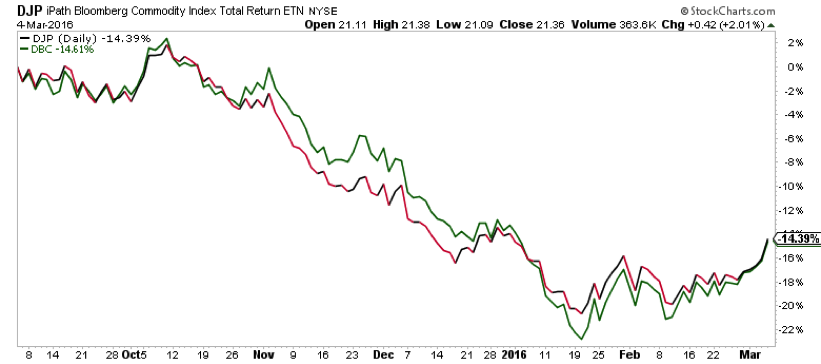
If you wish to forgo that tax headache, the iPath Bloomberg Commodity Index Total Return ETN (DJP) may be a potential alternative. DJP is an exchange-traded note that invests in a similar array of diversified commodities contracts. While the underlying index weightings may be slightly different than DBC, the end result is a similar exposure to multiple sectors of the commodity marketplace.
DJP charges an expense ratio of 0.70% and has total assets of $699 million. The ETN structure allows this fund to escape the consequences of a K-1 to shareholders, but comes with its own nuances as well. For instance, ETNs are considered debt instruments that are backed by the strength of the underlying issuer (in this case Barclays) rather than the actual basket of futures contracts. Investors considering these products should be aware of the pros and cons of each structure in order to make an informed decision that makes sense for their situation.
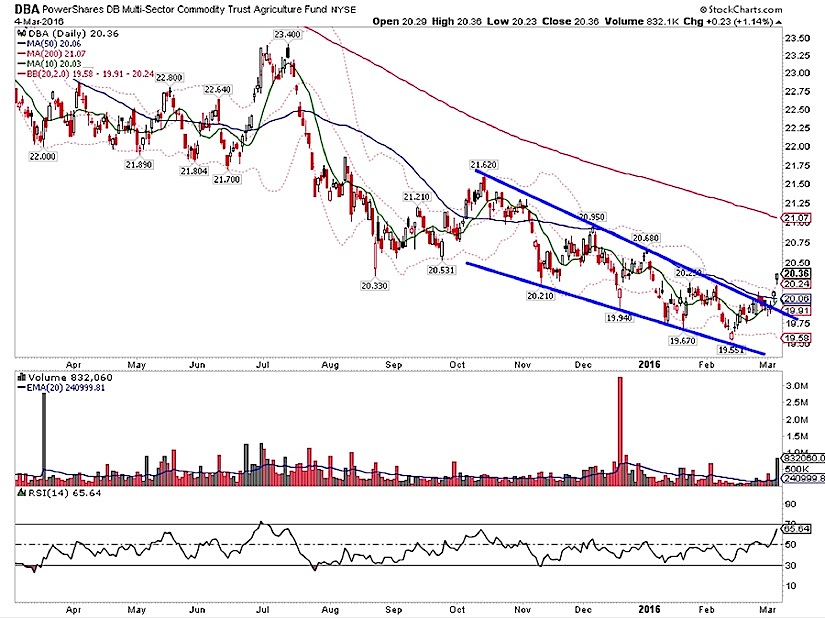
Lastly, the PowerShares DB Agriculture Fund (DBA) is another variant in this group for those who prefer to invest directly in soft commodities. DBA tracks agriculture staples such as corn, soybeans, cattle, coffee, cocoa, and sugar to name a few.
This commodity ETF is structured similarly to DBC from a tax perspective. It also charges an expense ratio of 0.89% and has $626 million in total assets. However, its greatest differentiating factor is that it eschews any exposure to precious metals or energy futures in its underlying holdings.
Analyzing The Technical Picture – Aaron Jackson
We’ve seen some tremendous rallies in the commodity complex with West Texas Crude Oil gaining 40% in 1 month and Gold rising 19% year to date.
As amazing as those rallies have been, major commodity indices are still clearly in long term downtrends. That said, the short and intermediate term trends have turned higher.
We can see this in DBC as it has formed a higher low in February and now has reached a higher high.
As you can see, the commodity ETFs of DBC and DJP share an incredibly similar performance. Sometimes choosing an ETF is as simple as figuring out your preferred tax structure. And that may be the case here.
Moving to DBA, it broke a nearly half year downtrend as a new rally is underway. Given the structure, we have a clear path up to the 200 day moving average around 21.
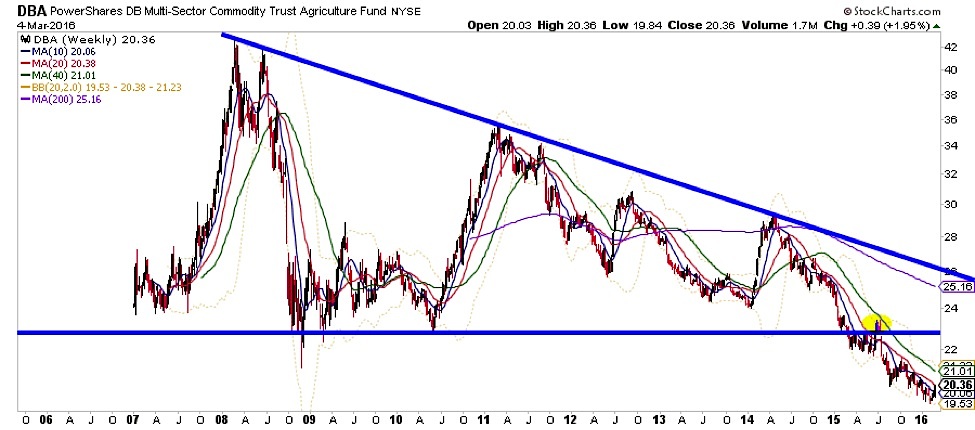
Looking at the long term weekly chart, we see how extensive this two year decline has been. We can also see the green line at 21.01, representing the falling 40 week moving average, will be a key resistance level moving forward.
Conclusions:
- When looking to purchase various ETFs, you have to understand each fund’s structure for tax purposes. Sometimes the main difference between two funds is its tax structure.
- Many commodity ETFs are overweight energy.
- Although we’re seeing some amazing rallies in commodity indices, they remain in strong long term downtrends.
This article is part of a series co-authored by David Fabian (fmdcapital.com) and Aaron Jackson (northstarta.com). Each week we will be unlocking the secrets to some of the most talked-about exchange-traded funds in the market. The goal is to better understand what you own or elevate new ideas to the forefront of your watch list.
Further “Know What You Own” Reading: “Billionaire ETFs Underperforming In 2016“
Twitter: @fabiancapital @ATMCharts
Neither author holds a position in the mentioned securities at the time of publication. Any opinions expressed herein are solely those of the authors, and do not in any way represent the views or opinions of each other or any other person or entity.


