Last week marked the quarterly release of important data from large hedge fund and billionaire investors disclosing their stakes in publicly traded companies. These 13F reports are required by the SEC to disclose the addition or subtraction of new shares in a position exceeding $100 million.
The advantage of these reports is that they can be used to discern what some of the top investment experts are buying or selling. Yet, rather than spending days pouring over these details, there are several ETFs that are designed to aggregate the top ideas of these titans.
Today we’ll simply call them the Billionaire ETFs.
KNOW WHAT YOU OWN: BILLIONAIRE ETF’S
Reviewing The Playing Field – David Fabian
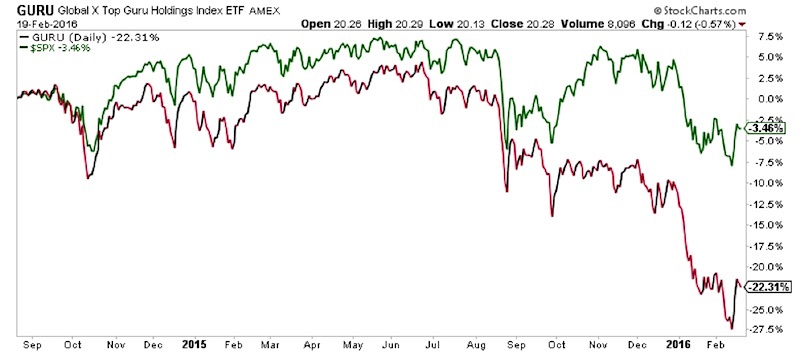
The most established entrant in the field of Billionaire ETFs is the Global X Guru Index ETF (GURU), which debuted in 2012 and has over $118 million in total assets. This smart beta ETF operates by following a passive index designed to screen the top U.S.-listed holdings of the world’s largest hedge funds. The end result is a portfolio of over 40 stocks comprising mostly large and mid-cap companies such as Valeant Pharmaceuticals (VRX) and Facebook Inc (FB) at present.
GURU charges an expense ratio of 0.75% and according to the fund provider website has a beta to the S&P 500 Index of 1.14. This means that GURU will typically act in a more volatile way than the market benchmark because of its concentrated number of securities and weightings.
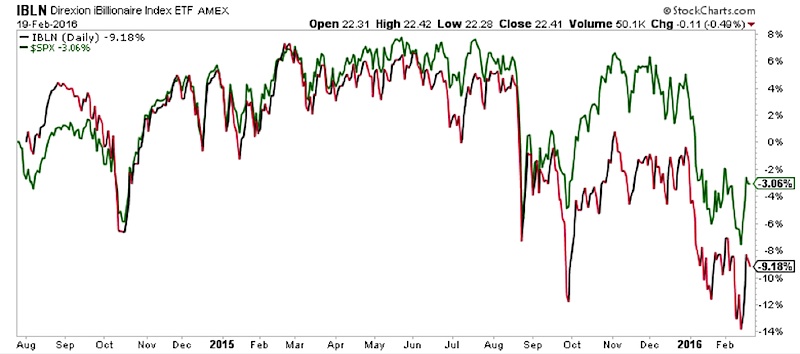
Another option for investors seeking an alternative alpha strategy is the Direxion iBillionaire ETF (IBLN). This ETF is comprised of 30 large-cap stocks as disclosed by a group of 5-10 billionaire investors. The fund is equal weighted to ensure a similar distribution of capital across each underlying holding and rebalanced on a quarterly basis.
IBLN charges a net expense ratio of 0.65% and has $21 million in assets under management. In addition, it currently has its top holdings focused in pharmaceutical, internet, and retail stocks.
It should be noted both “Billionaire ETFs” do not seek to actively track hedge fund returns and may invest in securities after the 13F data has become stale due to the lag time in filing requirements. In addition, the diversification of numerous trading strategies may lead to higher turnover rates than traditional passively managed benchmarks.
The sources for any ETF stats are directly from the fund/ETF websites.
Analyzing The Technical Picture – Aaron Jackson
The higher turnover in these ETFs is very concerning. Let’s take a look at the recent performance relative to the S&P 500 to see if those concerns are validated.
Dave pointed out the 1.14 beta of GURU. That level is very evident in the fund’s underperformance during the market decline. This drastic underperformance is also a great reminder that beta isn’t the best tool to measure risk.
Moving to IBLN, we see the underperformance isn’t quite as drastic, but the fund has underperformed the market since inception.
Mechanically speaking, following widely held stocks on a trailing basis seems doomed for underperformance.
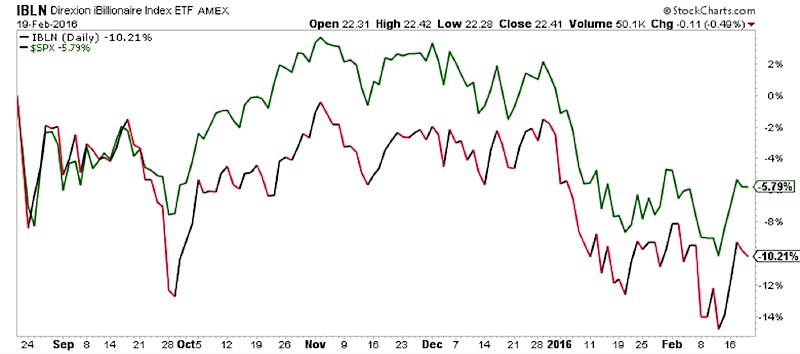
The price performance data appears to back that thesis up, at least at the recent market peak. Since the S&P 500 correction began in August, the index has notably lagged the market.
Conclusions:
- The methodology and implementation of these “Billionaire ETFs” makes it very difficult to expect significant market outperformance
- It appears IBLN’s method is much more conducive to handling market pullbacks.
- Beta does NOT effectively measure risk
This article is part of a series co-authored by David Fabian (fmdcapital.com) and Aaron Jackson (northstarta.com). Each week we will be unlocking the secrets to some of the most talked-about exchange-traded funds in the market. The goal is to better understand what you own or elevate new ideas to the forefront of your watch list.
Twitter: @fabiancapital @ATMCharts
Neither author holds a position in the mentioned securities at the time of publication. Any opinions expressed herein are solely those of the authors, and do not in any way represent the views or opinions of each other or any other person or entity.

: Worrisome to Broader Market?")


