As Coffee Futures flirt with the 130 price level, there’s a chance that the low for this move is in. In order to understand the case for why a Coffee Futures (KC_F) bottom may be here, we need to dive into the charts and study the “price” action. Note that you can also learn more about this type of setup by reading my 2013 post on Copper.
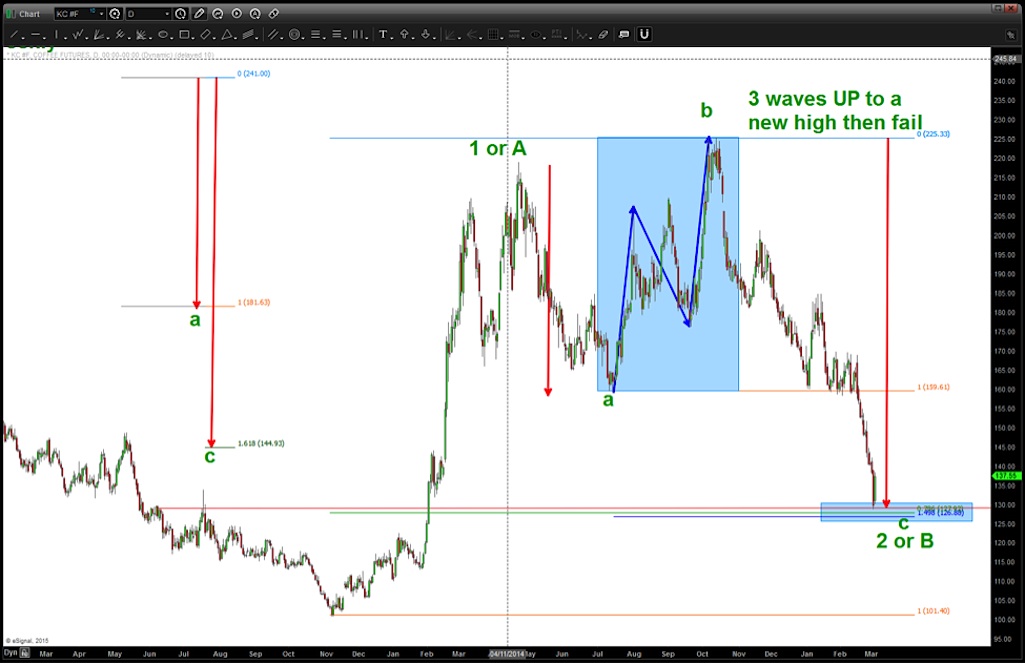
In the Copper post referenced above, you’ll find a real time chart breakdown of the developing pattern that was all based on three waves going up that make a new high and then fail. Folks, this is the handiwork of a classic B wave in an expanded flat correction. For more, read Elliott Wave Principle page 46.
This same PATTERN has developed in Coffee Futures. And I’d like to walk you through the charts before tying in some thoughts on Starbucks (SBUX).
Here’s the monthly chart of Coffee futures showing the extremely strong support that came in at the .786 retracement of the all-time low:
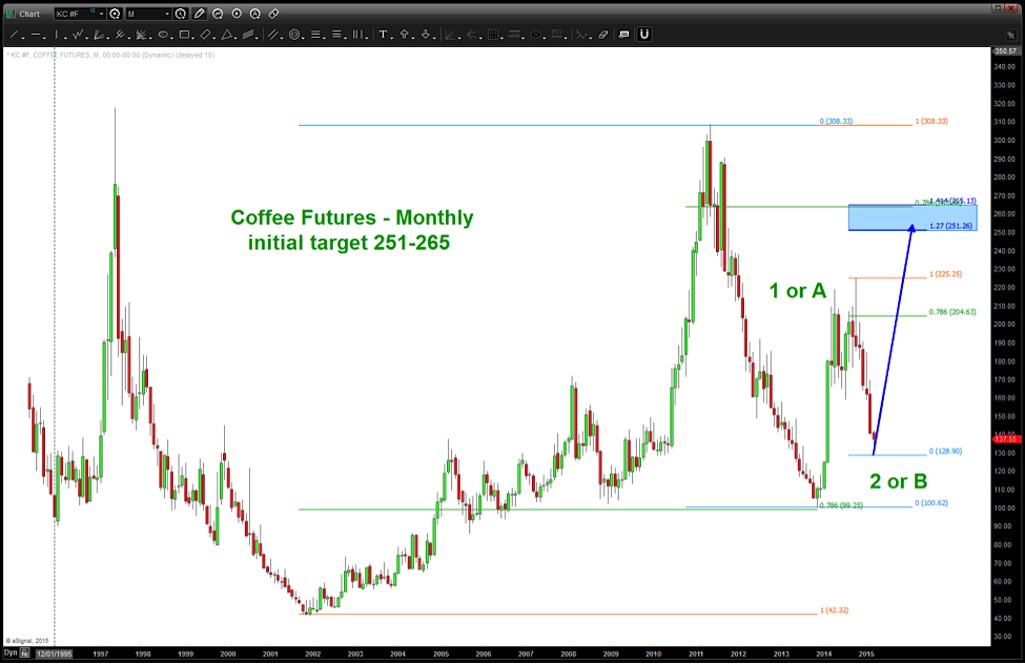
My price data for Coffee Futures only goes back to 1995. So I’m going to assume a count from the 99.25 low. And since it was in 5 waves off the bottom, at a minimum we have another move coming to take out the prior highs. Hence you can see I have labeled the count “1 or A” and then the most recent low as “2 or B”.
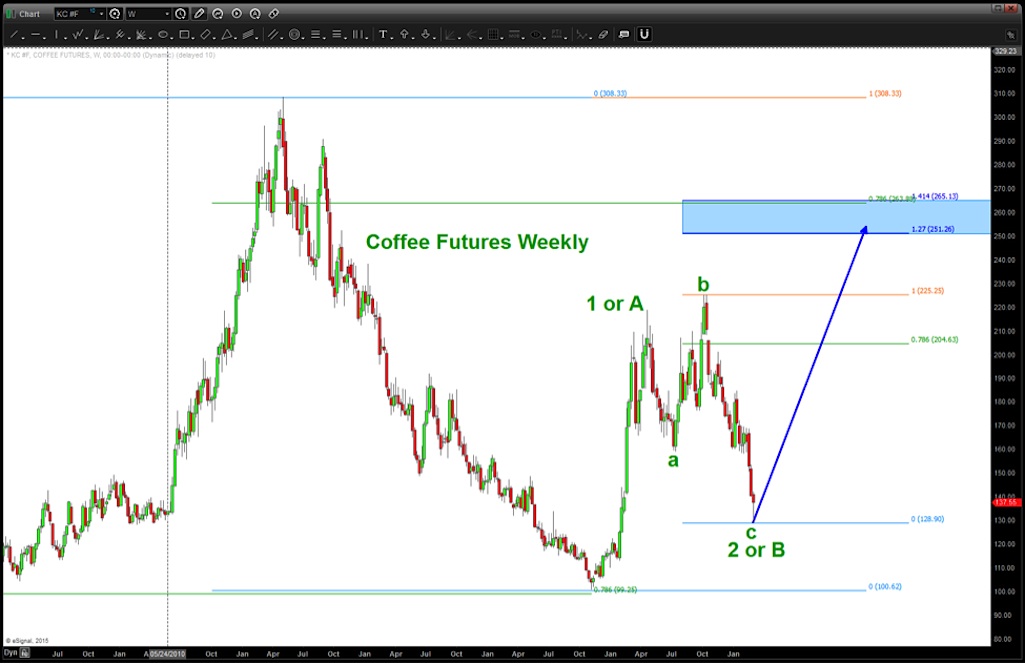
Below is the weekly picture showing a little more granular aspect of the current move that is occurring.
In the Daily chart above you can see the classic a*1.618 = c and that hit perfectly yesterday. We are right in a cluster zone of ratios in addition to the pattern and with the price action of today, a bottom could be in place. As well, since it’s a “2 or B” THEN we “should” see prices take out the highs from 225 over the coming months. Risk reward is in now favorable.
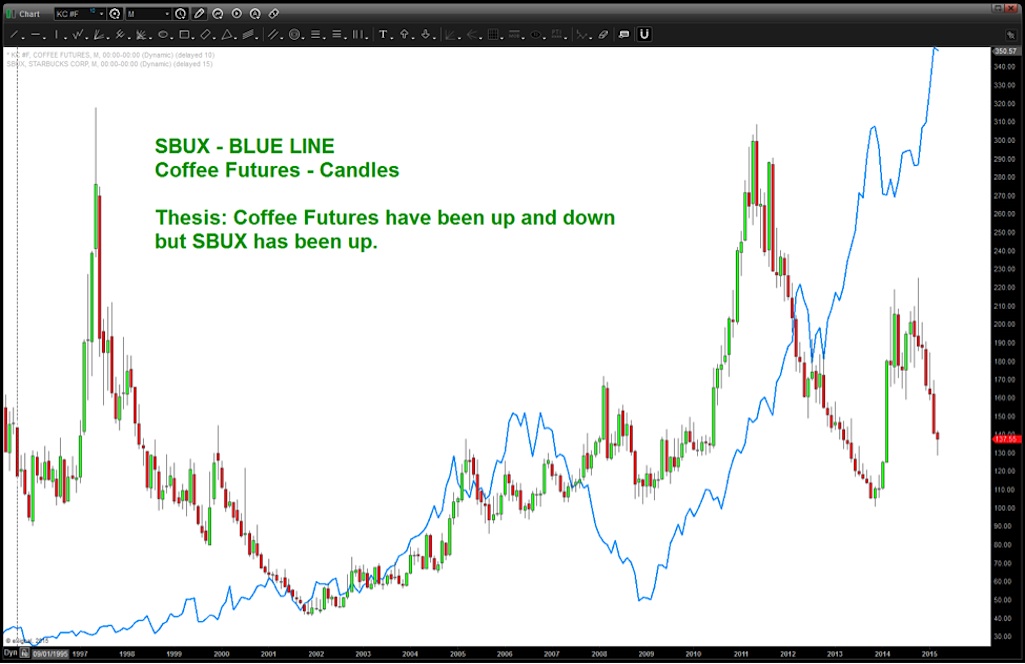
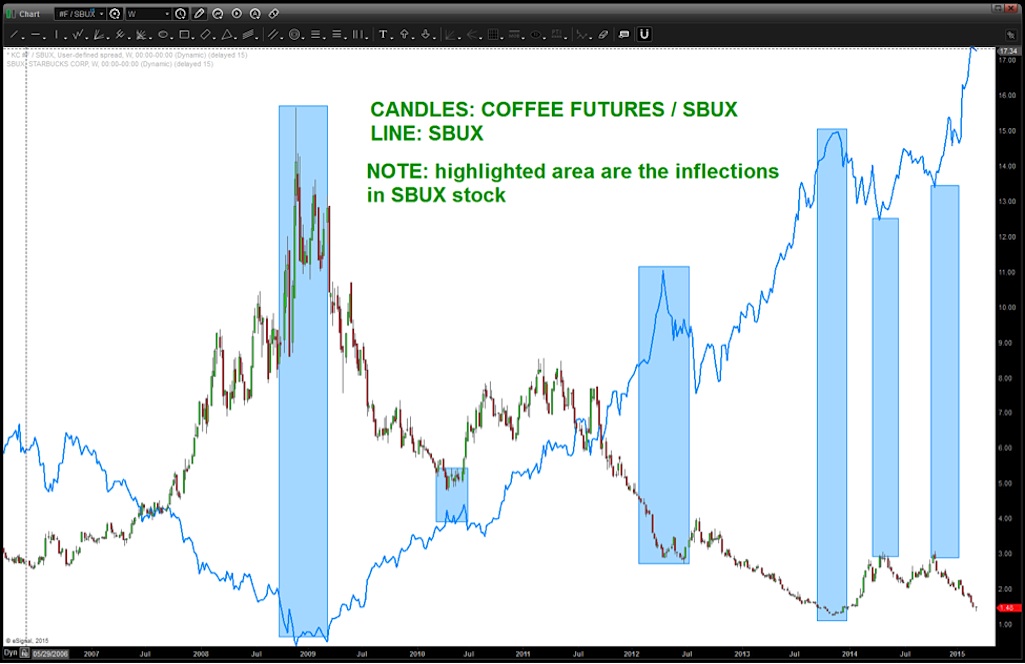
So, what does that do to Starbucks stock price (SBUX)? One would think that the price of coffee would have an effect on SBUX. It doesn’t, the chart below shows it.
It has to effect it to a certain degree, doesn’t it? How about the relative strength of Coffee Futures compared to Starbucks? (KC_F / SBUX)
As you can see below the relative strength of Coffee compared to SBUX has been getting crushed. But here’s the key – any inflection point in SBUX came when the relative strength of Coffee/SBUX inflected!
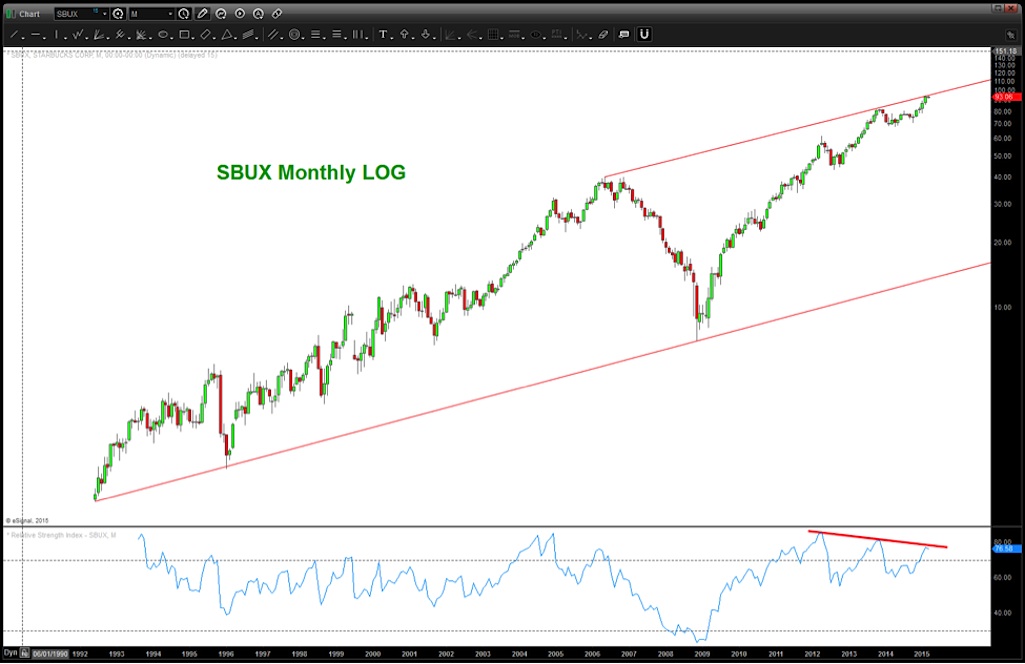
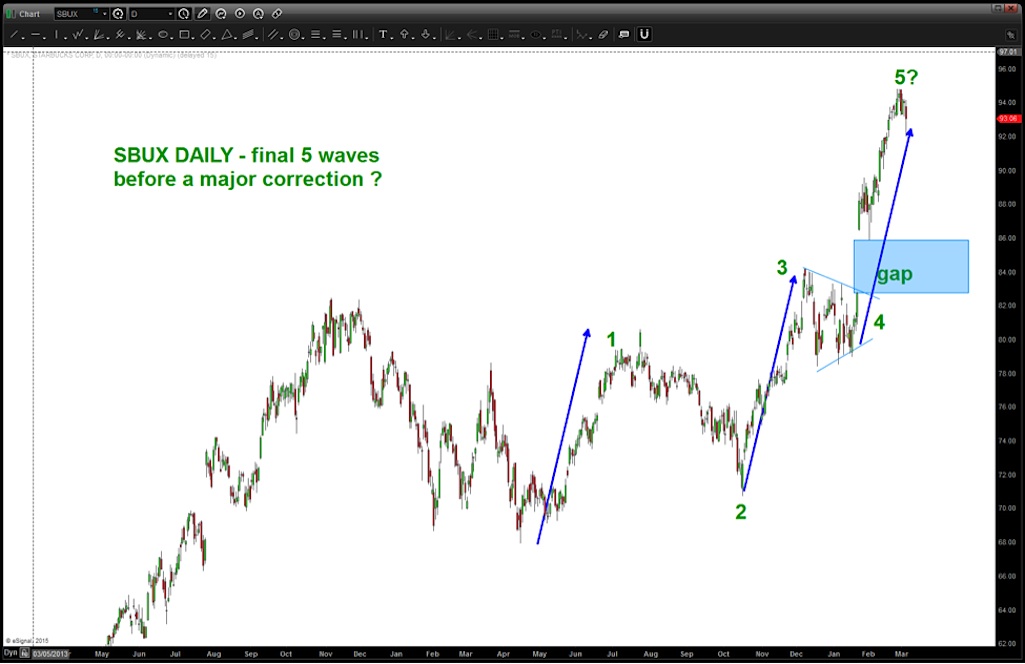
So, the relative strength of Coffee/SBUX appears to be finishing it’s correction AND take a look at the SBUX chart below. In this long term LOG scale chart, we can see upper channel resistance with a bearish divergence present. It appears that we may have one more “down up” sequence to complete 5 and that could be the top in SBUX for a while.
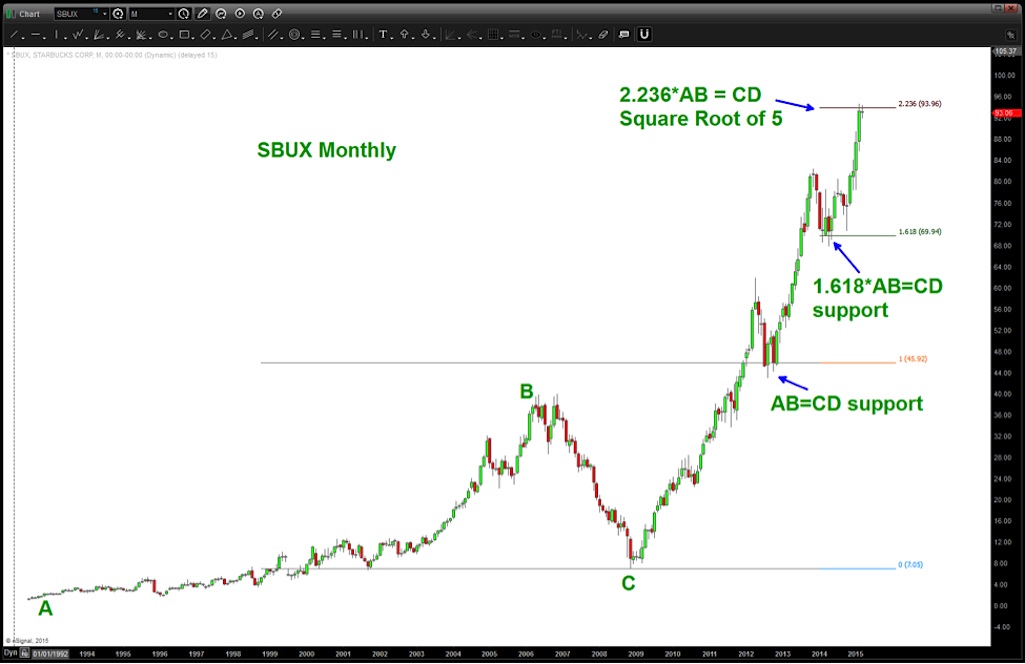
Bringing this to a logical conclusion, the charts above show the targets hit and the potential – with the relative strength of Coffee/SBUX improving (finding a low) – of a major correction in Starbucks stock upcoming.
Thanks for reading.
Follow Bart on Twitter: @BartsCharts
No position in any of the mentioned securities at the time of publication. Any opinions expressed herein are solely those of the author, and do not in any way represent the views or opinions of any other person or entity.


