Chinese stocks have been mired in selling for the past 15 months.
Just look at the “weekly” chart of $FXI (shares China ETF) below.
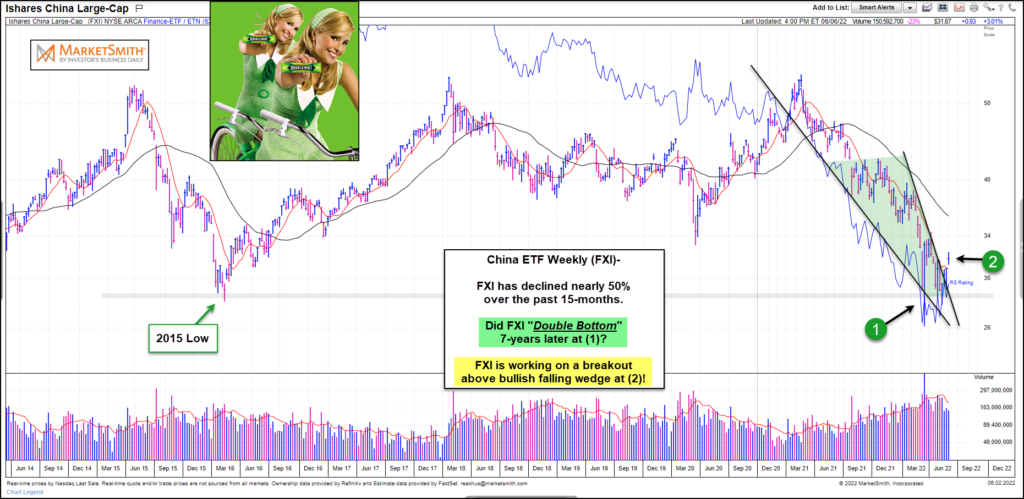
As you can see, the decline accelerated into early 2022 before putting in a double bottom formation at (1). This marked a 50% decline and saw FXI touch down near the 2015 low.
As well, the price pattern took the shape of a bullish falling wedge pattern. And now price is breaking out of the pattern at (2).
If this breakout sticks, it would be bullish for Chinese stocks and FXI… and may signal the end of the bear market for FXI. Stay tuned!
$FXI China ETF “weekly” Chart
Note that KimbleCharting is offering a 2 week Free trial to See It Market readers. Just send me an email to services@kimblechartingsolutions.com for details to get set up.
Twitter: @KimbleCharting
Any opinions expressed herein are solely those of the author, and do not in any way represent the views or opinions of any other person or entity.

: Showing Some Signs of Emerging Strength")
