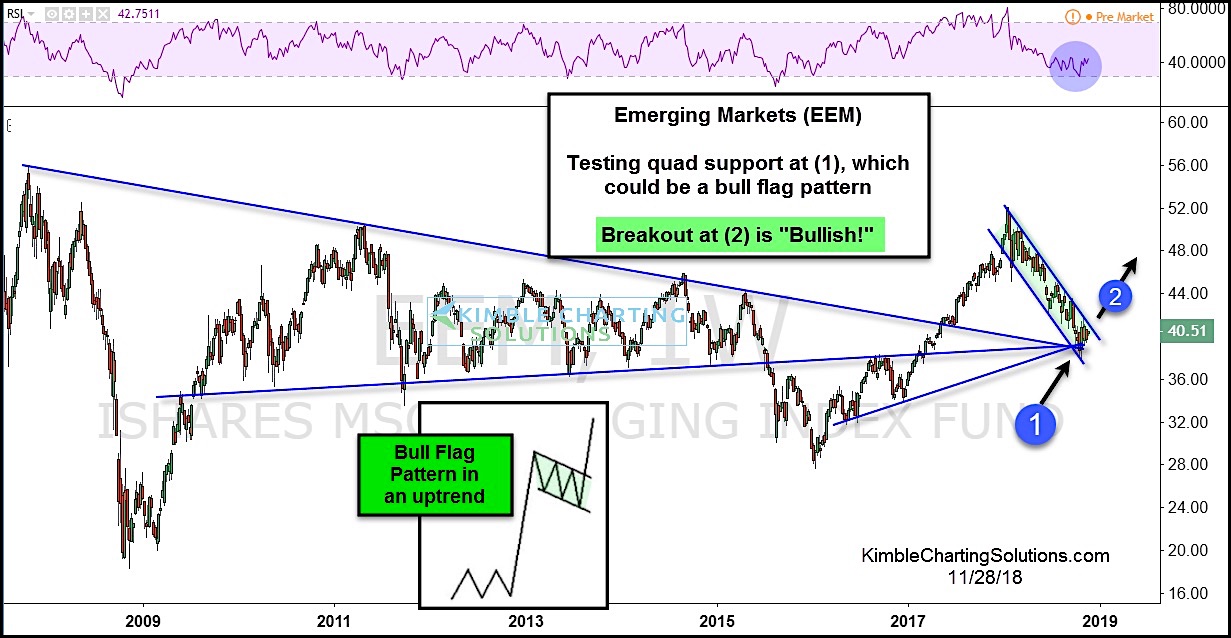
It’s time to put the Emerging Markets (NYSEARCA: EEM) on your radar.
Although the near-term trend is down, the broader price pattern is taking the shape of a bullish flag pattern.
And a breakout here would signal a trend change.
Let’s look at the chart… As you can see, there is a potential bull flag pattern in play for the hard-hit Emerging Markets ETF (EEM). If it breaks out at (2), it should attract buyers.
The latest bounce comes off of quadruple support at (1).
A breakout above channel resistance would be very bullish near-term. While another thrust lower would keep bears in control. Stay tuned!
Emerging Markets (EEM) Chart – Breakout Coming?
Note that KimbleCharting is offering a 2 week Free trial to See It Market readers. Just send me an email to services@kimblechartingsolutions.com for details to get set up.
Twitter: @KimbleCharting
Any opinions expressed herein are solely those of the author, and do not in any way represent the views or opinions of any other person or entity.


: Showing Some Signs of Emerging Strength")
