The health of our banking and financial sector is critically important to a strong economy.
It’s also important to the stock market.
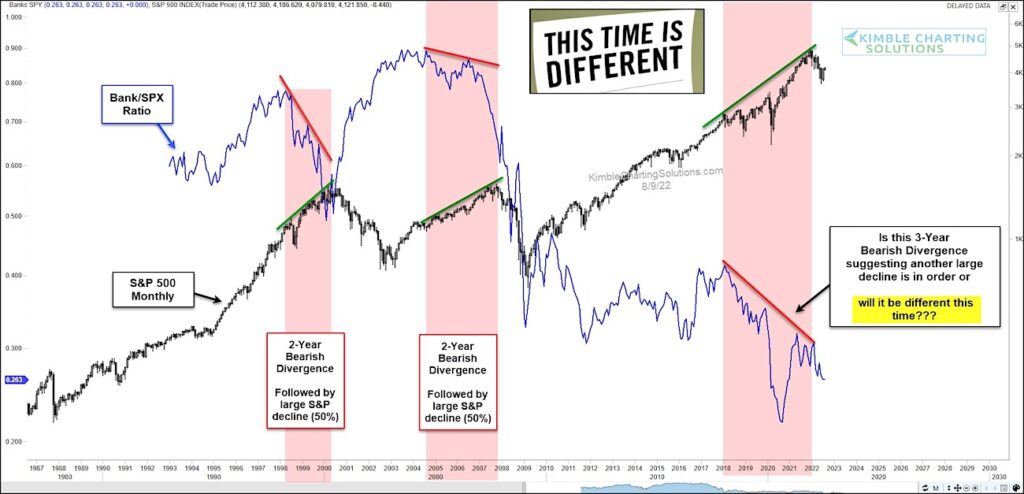
Today, we look at a long-term ratio chart of the Bank to S&P 500 Indices. We also compare this to the S&P 500 Index performance to identify patterns of importance.
In this regard, the chart highlights 3 key bearish divergences. The last two happened to last 2 years in length and lead to big downturns. The current one is 3 years old. Despite rising interest rates, banks continue to underperform.
Also, when considering that stocks have not performed well this year, it adds to worries that there could be much further to fall!
Now we must ask: Is the Bank/S&P 500 Index ratio sending another important bearish message… or will it be different this time? Stay tuned!
Bank / S&P 500 Index Ratio Chart
Note that KimbleCharting is offering a 2 week Free trial to See It Market readers. Just send me an email to services@kimblechartingsolutions.com for details to get set up.
Twitter: @KimbleCharting
Any opinions expressed herein are solely those of the author, and do not in any way represent the views or opinions of any other person or entity.
: Creating Bullish Divergence?")


: Creating Bullish Divergence?")